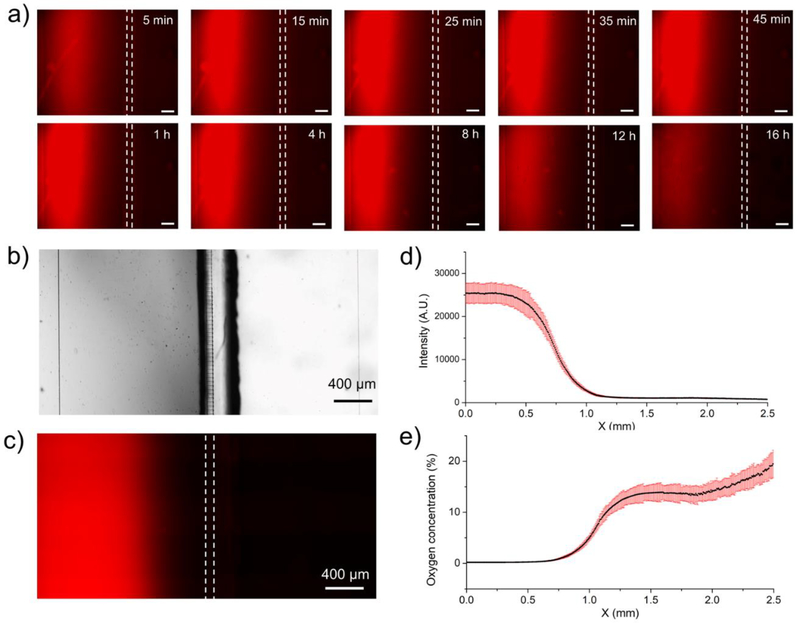
Fig. 4: Characterizing hypoxia in a microfluidic co-culture device.
a) Time-lapse images of oxygen sensing fluorescence dye to show how the hypoxia in left chamber was established in the first 45 minutes and lasted for 16 hours. The scale bars are 200μm in these figures. b) A bright-field image of the two-chamber device. c) Fluorescence intensity as a function of location in a co-culture device. Both images were taken at the same location. High fluorescence signal on the left indicate hypoxia, low fluorescence on the right of the device indicates normoxia. d) Measured fluorescence intensity in x direction. e) Fluorescence intensity was converted into oxygen concentration using a calibration curve (described in Fig. S5).

