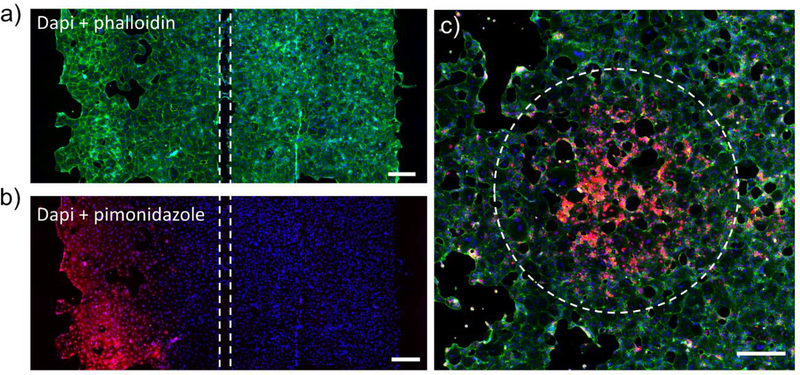
Fig. 5: Effects of local hypoxia on cells in a microfluidic co-culture device.
Hypoxia was induced in the left culture chamber for 2 h, then cells in both chambers were stained with the hypoxic probe. a) Staining for actin (phalloidin -green) and nuclei (Dapi - blue) demonstrating similar cell distribution, density and morphology in both culture chambers. b) Immunofluorescent staining for PMDZ adducts demonstrate that cells in the left chamber were exposed to hypoxic conditions (pO2 < 10mmHg) while cells in the right chamber remained normoxic. c) Immunofluorescent staining for PMDZ(red), actin (phalloidin -green) and nuclei (Dapi - blue) to show a circular hypoxic pattern. The scale bars are 200μm in all figures.

