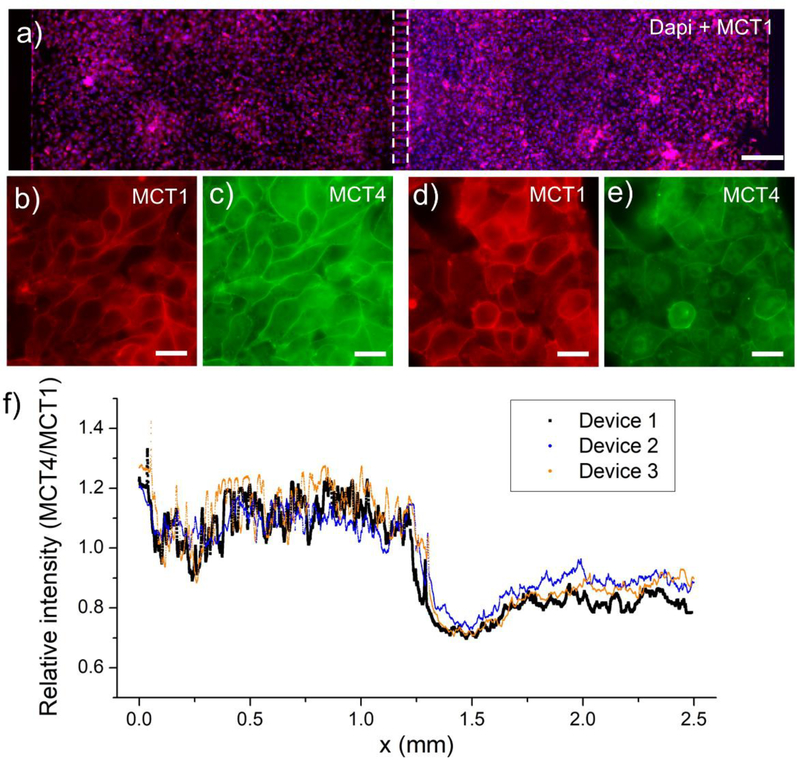
Fig. 6: Metabolic adaptation of liver cancer cells induced by local hypoxia in a microfluidic co-culture device.
a) An immunostaining of MCT1 (red) and Dapi (blue) to show the Caco2 cells in the two chambers. The scale bar is 200μm. b-e) Immunofluorescence staining for lactate efflux (MCT4) and influx (MCT1) transporters in a co-culture device where HepG2 cells in the left chamber are exposed to low oxygen conditions whereas HepG2 cells in the right chamber are under normal oxygen conditions. f) The ratio of MCT4/MCT1 expression across the two chambers demonstrating that lactate efflux transporter (MCT4) is expressed at a higher level in cells exposed to hypoxia. Conversely expression of lactate influx transporter (MCT1) was expressed at a higher level in normoxic cells than in neighboring hypoxic cells

