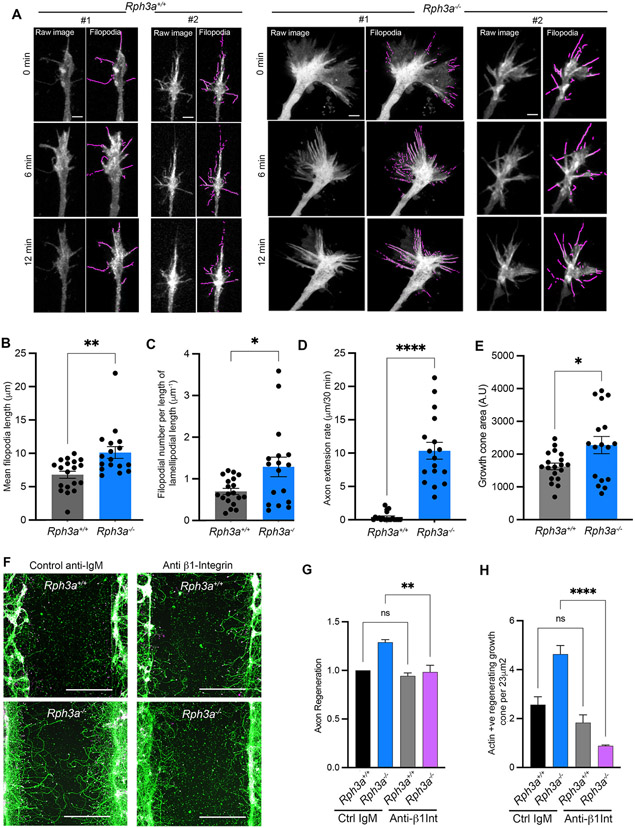
Fig. 5. Increased filopodia and integrin-dependent axon extension of regenerating Rph3a−/− growth cones.
(A) Time lapse imaging of regenerating growth cones of cortical neurons from Rph3a+/+ (n = 19) and Rph3a−/− (n = 17), 5–7 days post axotomy. Cortical neurons were transfected with Life Act-mScarlet to label F-actin rich filopodial structures. Maximum intensity z-projection for three time points were shown for each genotype. Left are raw images used for automatic filopodia detection, highlighted in purple. Scale bar, 5 μm.
(B) Quantification of filopodial length for 30 min time-lapse, mean ± SEM for individual growth cones from 3 biological replicates. **p = 0.0035 (U = 71), by non-parametrie Mann-Whitney test.
(C) The ratio of filopodial number to the edge length of lamellipodia, mean ± SEM. *p = 0.0415 (U = 92), by non-parametric Mann-Whitney test.
(D) The rate of axon extension over 30 min time-lapse window, mean ± SEM. ****p < 0.0001 (U = 0), by non-parametric Mann-Whitney test.
(E) Area of regenerating growth cones from experiment as in A. *p < 0.05 (U = 0), by non-parametric Mann-Whitney test.
(F) Integrin Function-Blocking Antibody prevents axonal regeneration of Rph3a−/− neurons. Representative images of Rph3a+/+ and Rph3a−/− regenerated axons, 7 days post-axotomy, treated with ß1-Integrin function-blocking antibody and its respective isotype control. Cortical neurons were stained for ßIII-tubulin (green) and phalloidin (magenta) to label regenerating axons and actin-rich growth cones.
(G and H) Graphs represent quantification of axonal regeneration and actin-rich regenerating growth cones. Data plotted are normalized mean values ± SEM from n = 3 biological replicates with a total of ~200,000 neurons/treatment/experiment. One-way ANOVA with Sidak’s (for F) and Tukey’s multiple comparison test (for G) statistic applied. **p = 0.0042 (F = 15.21, Df = 11), ****p < 0.0001 (F = 30.3, Df = 11). Scale bar, 200 μm.

