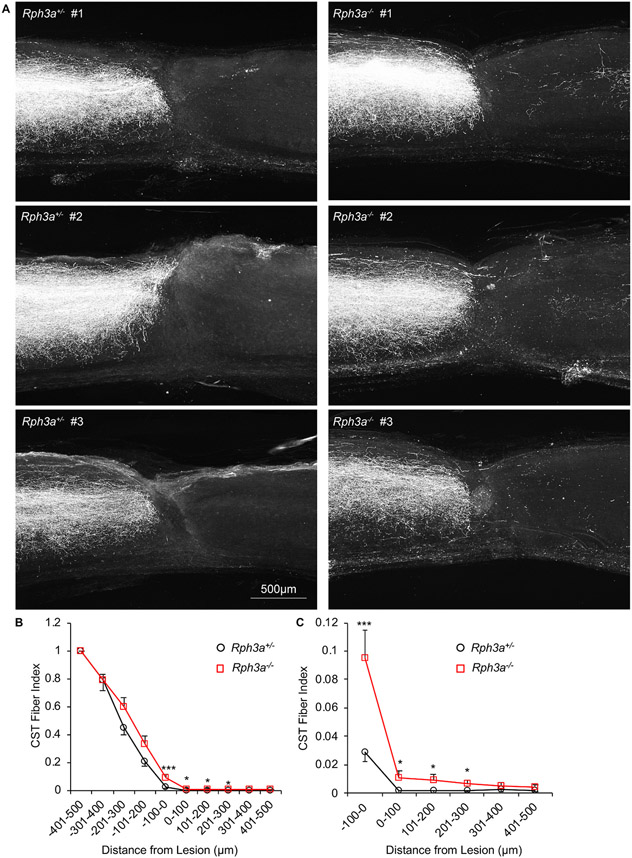
Fig. 8. Enhanced corticospinal axonal regeneration in Rph3a−/− mice after SCI.
(A) Representative confocal images of BDA labeled CST axons around the lesion site. The BDA labeled axons are white. All sections were overlaid. Dorsal is up and rostral is left. Scale bar represents 500 μm.
(B) Quantification of regenerating axons rostral (−500 μm) and caudal (500 μm) to the epicenter of the lesion site. The number of BDA-positive axons at indicated area is counted from all sections per animal. Data are mean ± SEM for n = 17 Rph3a+/− and n = 12 Rph3a−/−. By repeated-measure ANOVA, ***p = 0.001 (F = 12.48, dF = 1), for genotype effect between 100 μm rostral to 300 μm caudal, *p < 0.05 (F = 5.41, dF = 1, F = 4.50, dF = 1 and F = 4.69, dF = 1), ***p < 0.001 (F = 13.02, dF = 1) for indicated pairs by one-way ANOVA.
(C) High magnification graph of (B) between −100 to 500 μm.

