. 2022 Oct 12;130(10):107002. doi: 10.1289/EHP10255

Figure 4.

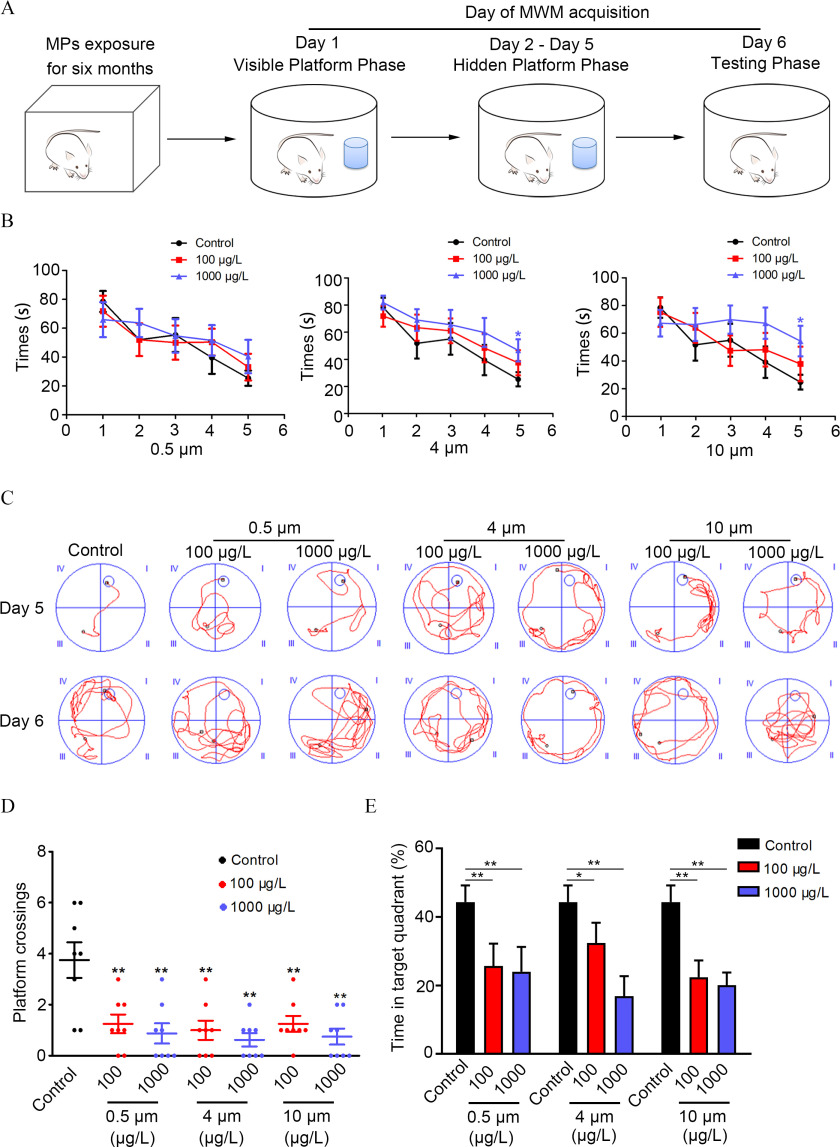
Figure 4A is a schematic timeline that depicts the following information: Microplastics exposure for six months leads to Day 1 of the visible platform phase with a cartoon illustration of a mouse inside a box. Day 1 of the visible platform phase leads to Days 2 to 5 of the hidden platform phase with a cartoon illustration of a mouse inside a pool with a platform. Days 2 to 5 of the hidden platform phase with a cartoon illustration of a mouse inside a pool with a platform leads to Day 6 of the testing phase with a cartoon illustration of a mouse inside a pool without a platform. Figure 4B is a set three line graphs, plotting times (seconds), ranging from 0 to 100 in increments of 20 (y-axis) across 0.5 micrometer, 4 micrometers, and 10 micrometers, each ranging from 0 to 6 in unit increments (x-axis) for control, 100 micrograms per liter, and 1,000 micrograms per liter. Figure 4C depicts swimming routes of mice with two rows, namely, Day 5 and Day 6, and four main columns, namely, control, 0.5 micrometer, 4 micrometers, and 10 micrometers. The columns, 0.5 micrometer, 4 micrometers, and 10 micrometers are subdivided into two columns, namely, 100 micrograms per liter and 1,000 micrograms per liter. Figure 4D is an error bar graph, plotting platform crossings, ranging from 0 to 8 in increments of 2 (y-axis) across columns, namely, control, 0.5 micrometer with 100 and 1,000, 4 micrometers with 100 and 1,000, and 10 micrometers with 100 and 1,000 (x-axis) for control and 100 micrograms per liter, and 1,000 micrograms per liter. Figure 4E is a set of bar graphs, plotting time in target quadrant (percentage), ranging from 0 to 60 in increments of 20 (y-axis) across control, 0.5 micrometer with 100 and 1,000, control, 4 micrometers with 100 and 1,000, control, and 10 micrometers with 100 and 1,000 (x-axis) for control and 100 micrograms per liter, and 1,000 micrograms per liter.

Spatial learning and memory ability in mice treated with polystyrene microplastics (PS-MPs). Mice were tested in a Morris water maze (MWM) experiment following treatment with PS-MPs for 180 days. (A) The experimental design of the MWM test is displayed. Day 1 was the visible platform phase, and the platform was set 1cm above the water level. Days 2–5 comprised the hidden platform phase, and additional water was added to the pool to submerge the platform to 1cm below the surface. Day 6 was the testing phase, and the platform was removed from the pool. The SMART digital tracking system (version 2.5; Panlab) was used to record the trial. The mean and SD summary data for quantification are shown in Table S3. p-Values for all comparisons are reported in Table S4. (B) The time it took the mice to move from the third quadrant to the target platform during the learning trials (days 1–5) was measured. The mean and SD summary data for quantification are shown in Table S3. p-Values for all comparisons are reported in Table S4. (C) Representative swimming routes of mice from the third quadrant to the target platform on the fifth and sixth days are shown. (D) The number of times the mice passed the target platform on sixth day are displayed. The mean and SD summary data for quantification are shown in Table S3. p-Values for all comparisons are reported in Table S4. (E) On the sixth day, the percentage of time the mice took in the quadrant where the target platform was placed was detected. Data are presented as the means±SD (N=10 mice/per group). The mean and SD summary data for quantification are shown in Table S3. p-Values for all comparisons are reported in Table S4. *p<0.05; **p<0.01 vs. control, as determined by one-way ANOVA followed by Dunnett’s multiple comparison tests. Note: ANOVA, analysis of variance; SD, standard deviation.