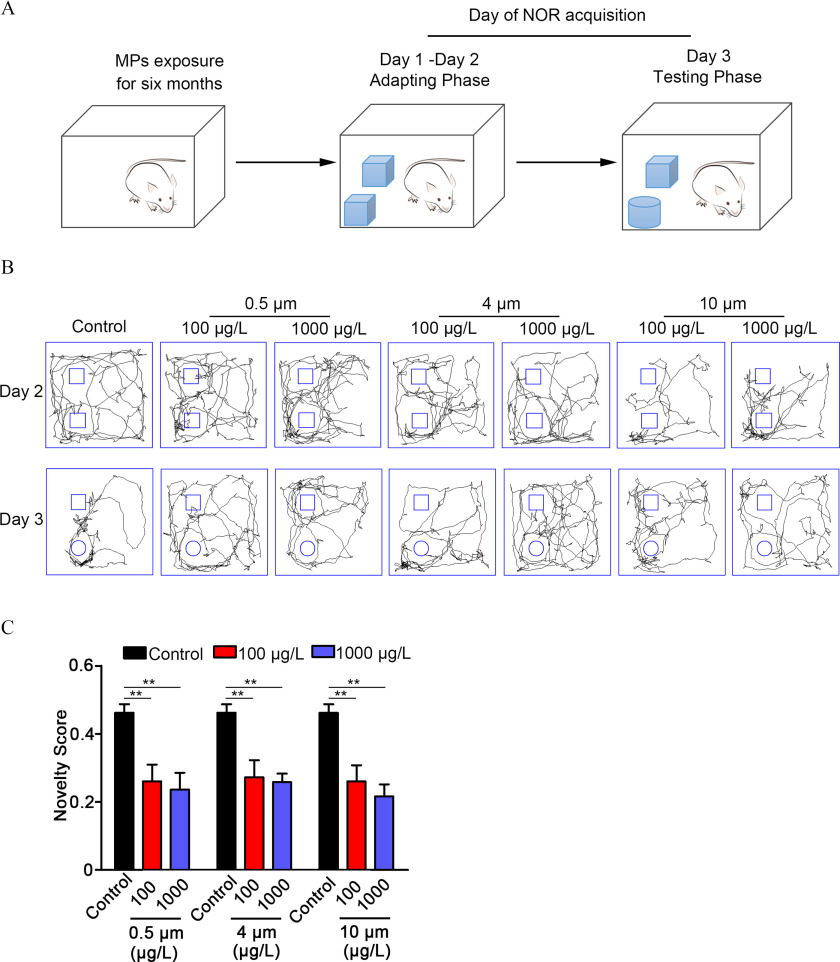
Figure 5.
Short-term recognition memory function in mice treated with polystyrene microplastics (PS-MPs). Three days after the Morris water maze (MWM) experiment, a novel object recognition (NOR) experiment was performed. (A) The experimental design of the NOR test is displayed. On the first and second days (training phase), two identical objects were placed in the experimental apparatus. Testing of object recognition memory (the third day) occurred 24 h after training. Mice were tested on their preference for a new object compared with the old object. All trials on both the training and testing days were videotaped and analyzed by the SMART digital tracking system (version 2.5; Panlab). (B) The walking routes of mice on the second and third days are shown. The pictures display representative animals in each group. (C) The novelty scores [time spent (s) investigating novel object divided by the time spent (s) investigating both objects in total] of mice were examined. The results are expressed as ( mice/per group). The mean and SD summary data for quantification are shown in Table S3. -Values for all comparisons are reported in Table S4. ** vs. control, as detected by one-way ANOVA followed by Dunnett’s multiple comparison tests. Note: ANOVA, analysis of variance; SD, standard deviation.

