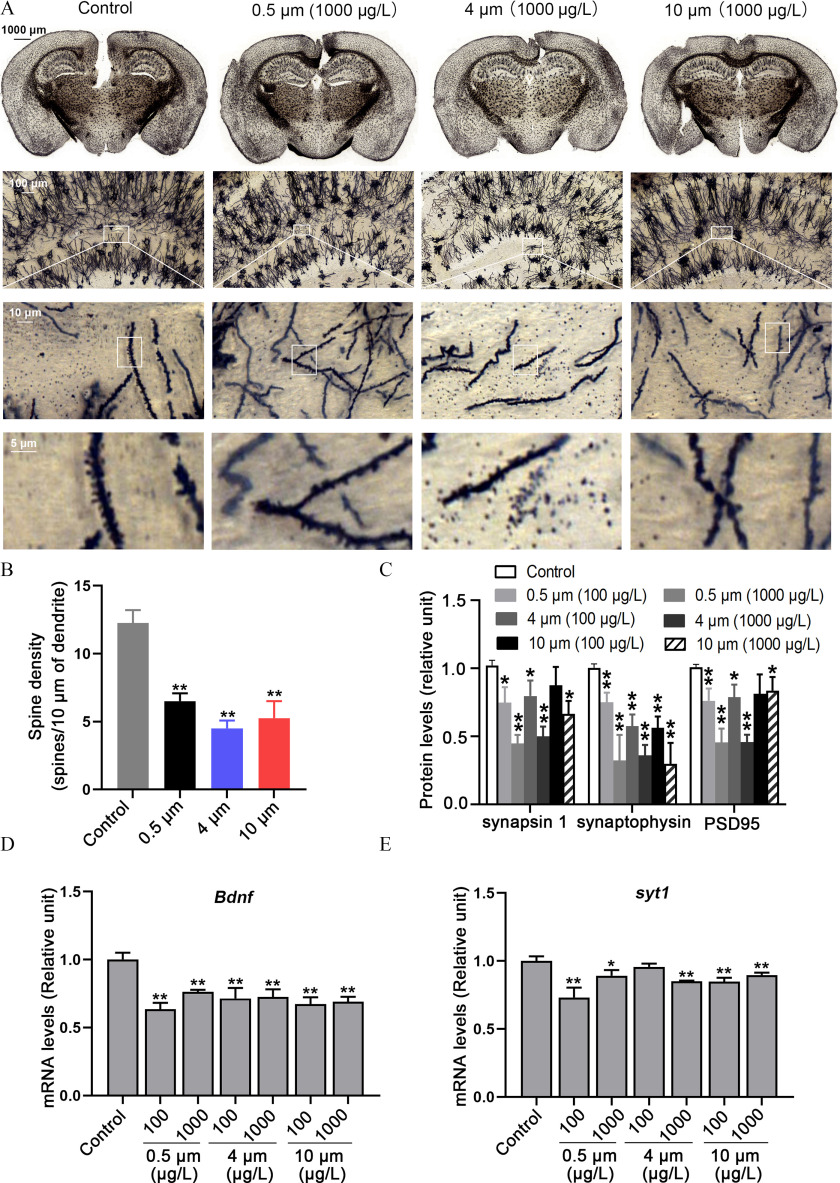
Figure 7.
The density of dendritic spines and expression of proteins related to synaptogenesis in the hippocampus of polystyrene microplastics (PS-MPs)–treated mice. (A) Golgi–Cox staining examined the effect of PS-MPs on the density of dendritic spines in the hippocampus. (B) The number of spines were counted. The mean and SD summary data for quantification are shown in Table S3. -Values for all comparisons are reported in Table S4. (C) The expression of synapsin 1, synaptophysin, and PSD 95 protein in the hippocampus was measured via western blotting. The western blotting results are shown in Figure S10. Quantification of western blotting evaluating synapsin 1, synaptophysin, and PSD95 protein in the hippocampus of PS-MPs treated mice. The expression levels were quantified with ImageJ36 (). Data are presented as the . The mean and SD summary data for quantification are shown in Table S3. -Values for all comparisons are reported in Table S4. *, ; **, compared with the control group, as determined by one-way ANOVA with Dunnett’s multiple comparison test. (D,E) The mRNA levels of Bdnf and syt 1 in the hippocampus were tested with qRT-PCR by normalizing to Gapdh. The results are expressed as (, mice/group). The mean and SD summary data for quantification are shown in Table S3. -Values for all comparisons are reported in Table S4. *; ** compared with the control group, as determined by one-way ANOVA followed by Dunnett’s multiple comparison tests. Note: ANOVA, analysis of variance; Bdnf, brain-derived neurotrophic factor; Gapdh, glyceraldehyde 3-phosphate dehydrogenase; qRT-PCT, quantitative real-time polymerase chain reaction; SD, standard deviation; syt1, synaptotagmin-1.

