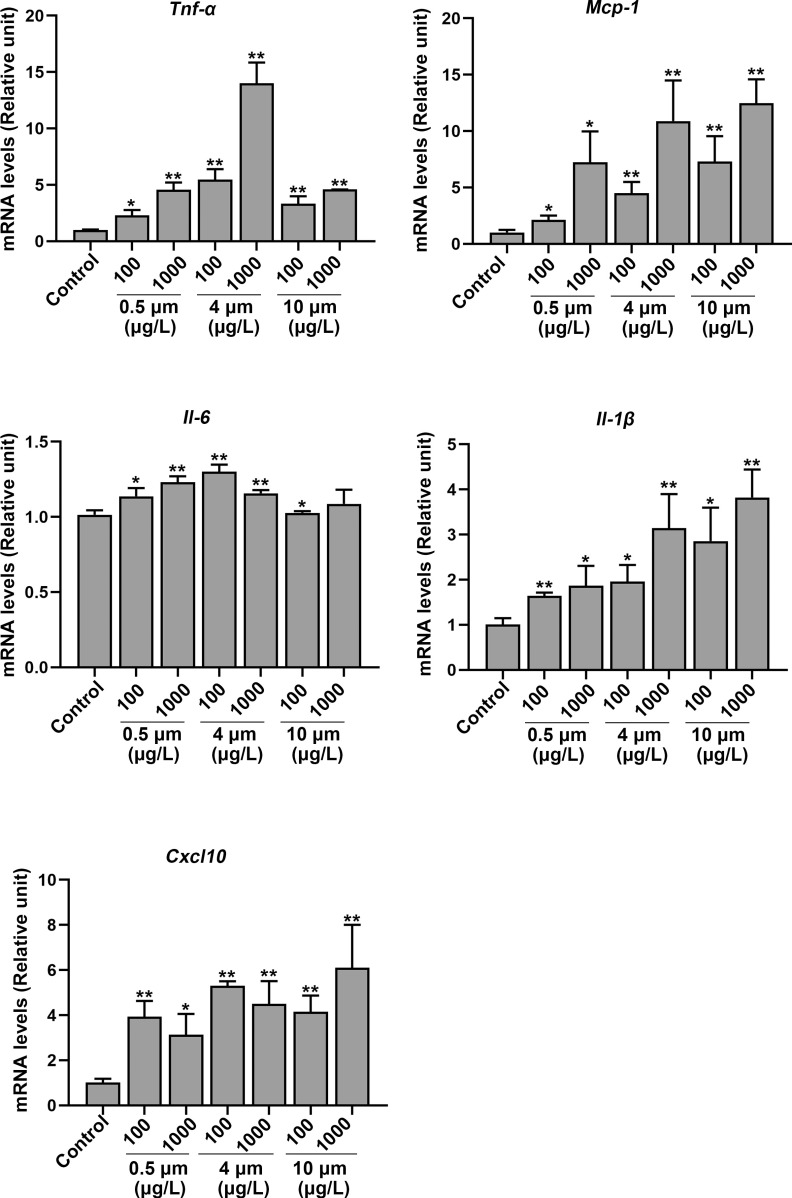
Figure 8.
mRNA expression of proteins related to inflammation in the hippocampus of polystyrene microplastics (PS-MPs)–treated mice. The levels of tumor necrosis factor alpha (), (), interleukin-6 (Il-6), chemokine (C-X-C motif) ligand 10 (Cxcl10), and monocyte chemoattractant protein-1 (Mcp-1) in the hippocampus were measured via qRT-PCR. Data are expressed as the for three independent experiments ( mice/group). The mean and SD summary data for quantification are shown in Table S3. -Values for all comparisons are reported in Table S4. *; ** vs. control, as detected by one-way ANOVA followed by Dunnett’s multiple comparison tests. Note: ANOVA, analysis of variance; qRT-PCT, quantitative real-time polymerase chain reaction; SD, standard deviation.

