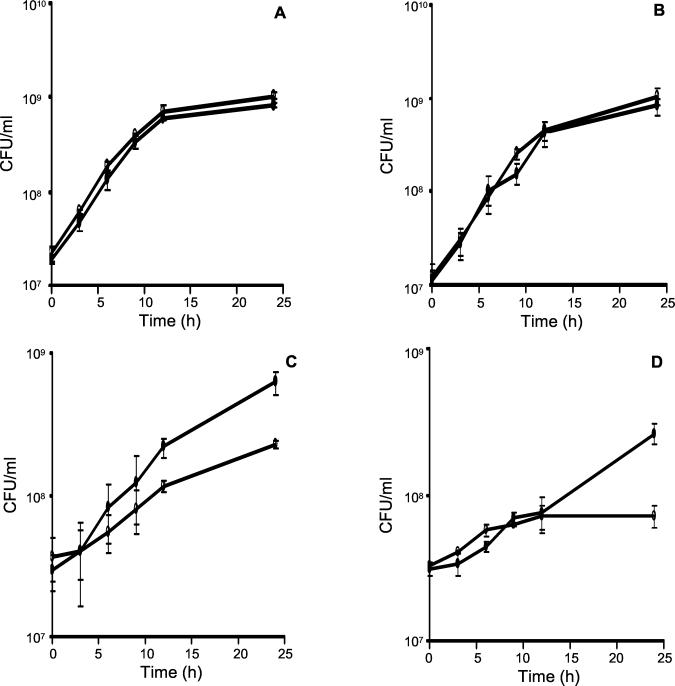
FIG. 3.
Growth of cocultures of wild-type and cyd mutant strains at various air saturation levels. The growth curves of mixed cultures of mc2155::pHINT (●) and cydA::aph (○) are shown for 21% (A), 5% (B), 1% (C), or 0.5% (D) air saturation for 24 h (see Materials and Methods for more details). The data are shown as the averages and standard deviations from three independent experiments. Statistical analysis of the data by using an analysis of variance test revealed that the cell counts of the mutant after 24 h of growth were significantly lower than for wild type at the lower aerations (0.5 and 1% air saturation; P < 0.05).

