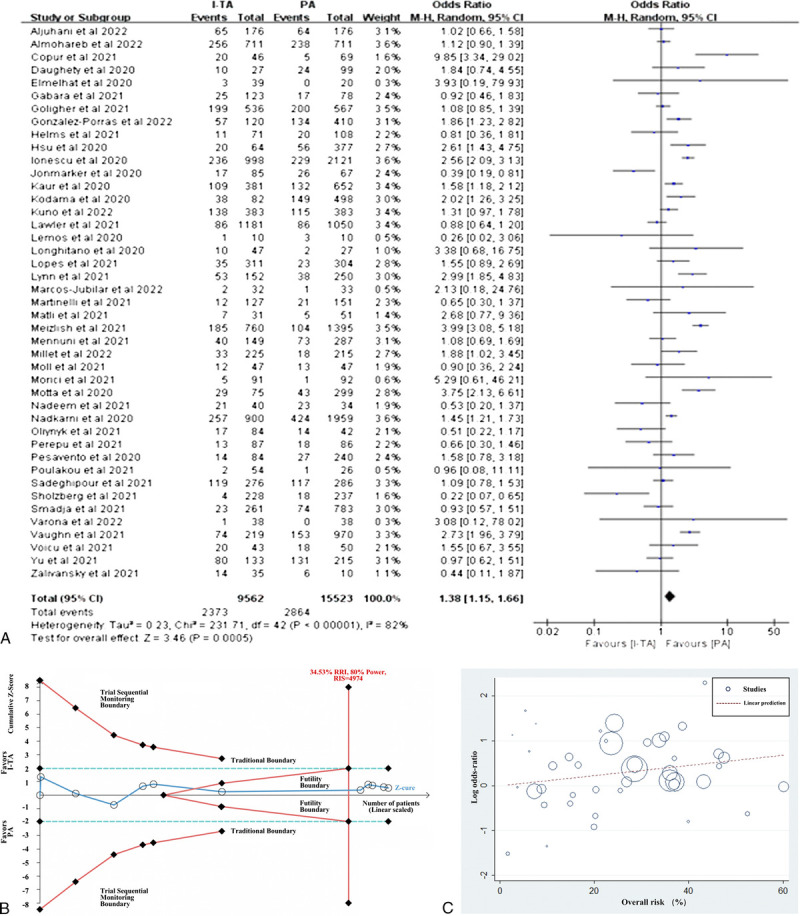
Figure 2.

Efficacy of intermediate-to-therapeutic versus prophylactic anticoagulation on mortality in patients with COVID-19. (A) Pooled OR and forest plot of mortality. Forty-three studies were included in the statistical analysis, with 9562 patients in the I-TA and 15,523 in the PA groups. The results showed that the mortality significantly decreased in the PA group compared with I-TA group (OR: 1.38; 95% CI: 1.15–1.66; P = 0.0005). (B) Trial sequential analysis of mortality. The X-axis represents sample size, and the Y-axis represents Z score. The uppermost and lowermost red curves represent trial sequential monitoring boundary lines for positive conclusion. The horizontal blue lines represent the conventional boundaries for statistical significance. The red triangular lines represent the futility boundary. The dark blue line is the Z curve representing the cumulative Z scores of included studies, arranged according to publication date. The RIS of 4974 was calculated using α = 0.05 (2-sided), β = 0.20 (power 80%), and the relative risk of mortality increase was 34.53%. The results showed that the cumulative Z curve exceeded the RIS line, the final cumulative Z score located in the zone between futility boundaries, and the TSA adjusted the 95% CI to be 0.71 to 1.26. (C) Meta-regression of the association between log OR for mortality and overall risk (%). CI, confidence interval; I-TA, intermediate-to-therapeutic anticoagulation; OR, odds ratio; PA, prophylactic anticoagulation; RIS, required information size; TSA, trial sequential analysis.
