
Figure 4.
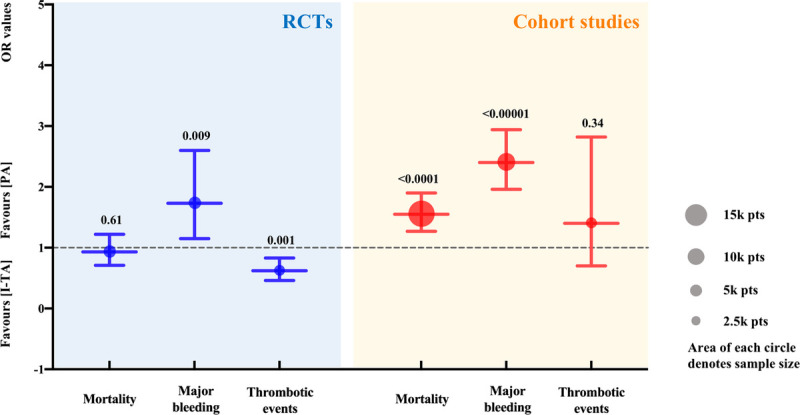
Subgroup analysis according to RCTs or cohort studies. The dashed line represents the null line (OR: 1). The blue and red lines and circles exhibit the results of RCTs and cohort studies, respectively. The size (area) of each circle denotes sample size. The lower and upper limits of the lines correspond to the 95% CI, the nodes in the middle represent pooled OR values, and the numbers on the top of the upper limits represent P values. CI, confidence interval; OR, odds ratio; pts, patients; RCTs, randomized controlled trials.