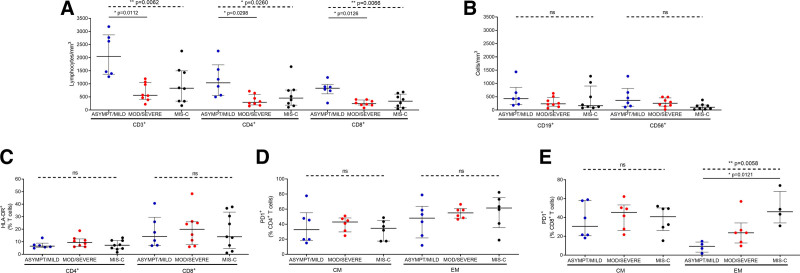
FIGURE 3.
Cellular immune profiles in pediatric patients with COVID-19. (A) Absolute numbers of T cell populations (CD3+, CD4+ and CD8+) and (B) absolute number of B cells (CD19+) and NK cells (CD56+), in asymptomatic/mild (n = 6), moderate/severe (n = 8) and MIS-C (n = 8) groups. (C) Activated CD4+ and CD8+ T cells (HLADR+) and (D, E) exhausted cells (PD1+) within CD4+ and CD8+T cell subpopulations; central memory T cells (CM, CD45RA-CD27+) and effector memory T cells (EM, CD45RA-CD27-). Lines represent median values with interquartile range. P values were calculated using the Kruskal-Wallis test (dashed line) and Dunn’s multiple comparison post-test (solid line) for comparisons between severity groups. P values showing significant post-test comparisons are displayed. A P value <0.05 was considered significant; * P < 0.05, ** P < 0.01, ns, non-significant. ASYMPT, asymptomatic; MOD, moderate.

