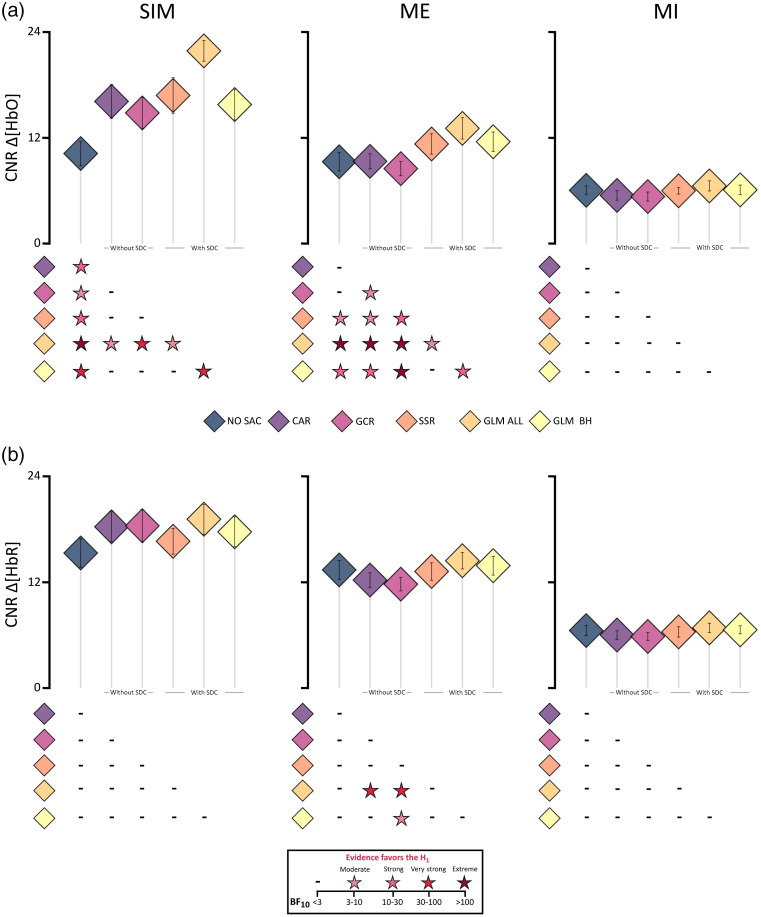
Fig. 4.
Illustration of the contrast-to-noise ratio (CNR) results including all three data types (columns: SIM, ME, and MI) of (a) and (b) . Diamonds represent mean CNR values and error bars represent standard error of the mean across participants. Below each subfigure statistical results are displayed by color coded stars representing Bayes factors , which indicate evidence favoring the alternative hypothesis , i.e., that there are differences between two correction methods. For details of statistical results including , see Tables S13–S18 in the Supplementary Material.

