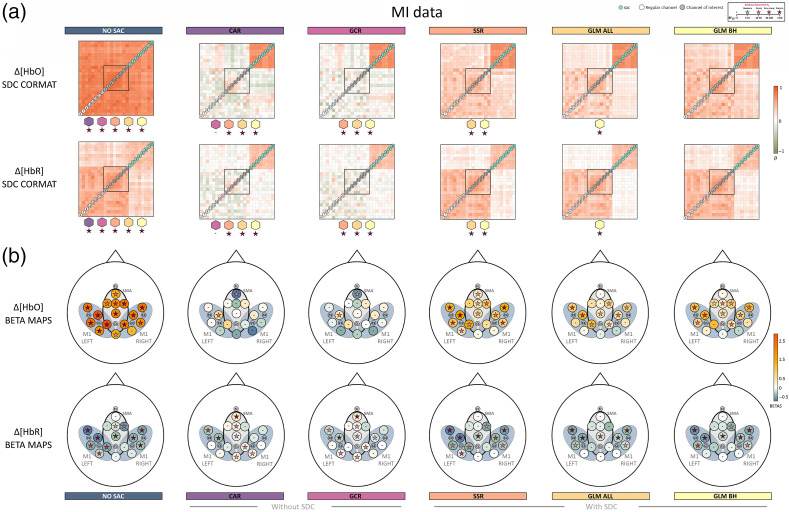
Fig. 7.
Illustration of the spatial specificity results for SIM data. (a) The averaged correlation matrices of and . Colored stars below a correlation matrix represent Bayes factors of the statistical comparison between the respective matrix and the matrix belonging to the correction method that is indicated by the colored polygon above the Bayes factor. Note that the order of the regular channels in the matrix is arbitrarily chosen in that the order always starts in the lower left corner with channels outside the ROI (in ascending order, indicated by white circles) and are followed by channels inside the ROI (in ascending order, indicated by gray circles and corresponding to ROI M1 left). (b) The topographical beta maps (BETA MAPS) of and . Each circle represents a channel with its corresponding mean beta value. The star within a circle represents the Bayes factor resulting from the Bayesian -test of the beta values of the respective channel. The black oval marks the ROI, SMA.

