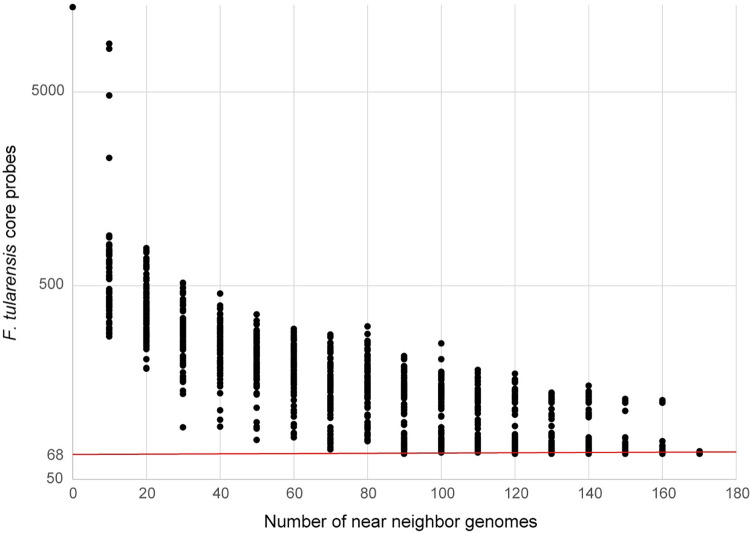
Fig 1. Signature erosion analysis of F. tularensis-specific probes.
F. tularensis near neighbor genomes were randomly sampled 100 times at different depths (0–170, sampled every 10) and then screened with F. tularensis core probes (n = 5,606) using LS-BSR/BLAT. The number of probes with a BSR value <0.4 were plotted, indicating that they were specific to F. tularensis and not present in sampled near neighbor genomes. The red line indicates the number of F. tularensis- specific probes (n = 68) identified using the entire near neighbor dataset (n = 172).

