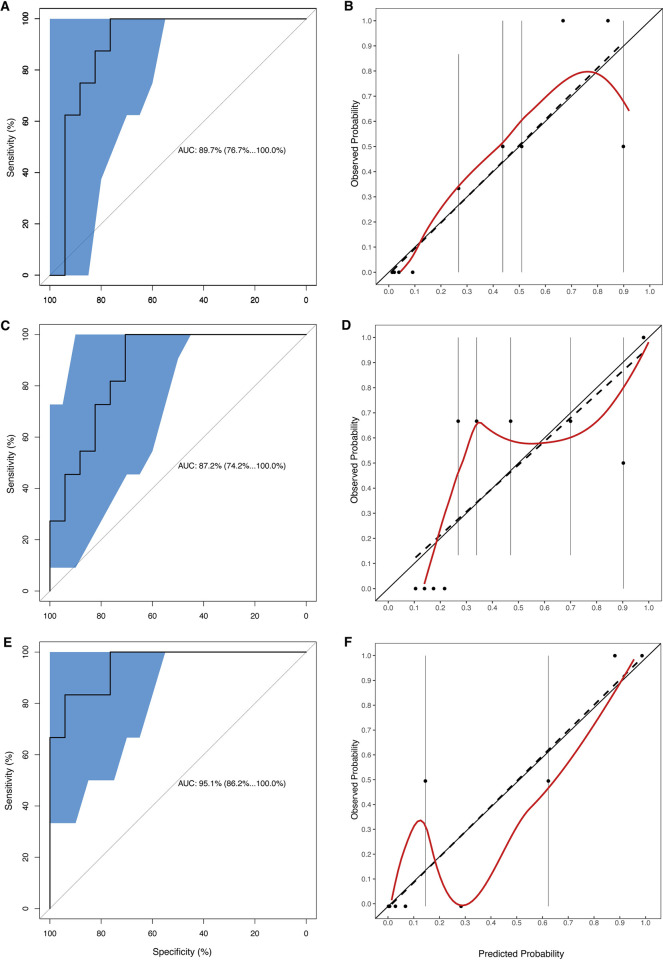
Fig 3. Discrimination and calibration curves.
Area under the receiver operating characteristic curves (AUC) (A, C, E) and calibration curves (B, D, F) of the Ebola Virus Disease Prognosis in Children (EPiC) model are shown with aspartate aminotransferase (AST) (A, B), creatine kinase (CK) (C, D), or both (E, F) as additional predictors for the Democratic Republic of the Congo validation dataset. The interpretation of the plots is the same as in Fig 2.

