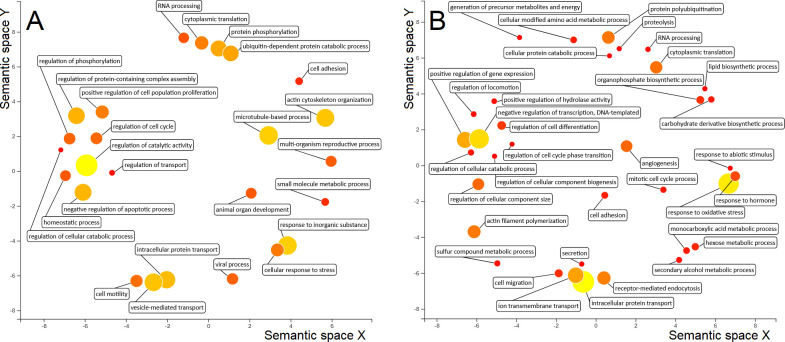
Fig 7. ReViGO plot showing the main GO terms within the Biological Process (BP) category in MPSIEC.
The BP GO terms corresponding to up- and down-regulated proteins in the cytosol (A) and membrane (B) extracts of MPSIEC after incubation with FhNEJ are shown. The size and colour of each circle represents the Nodescore of each GO term, and the spacing between circles refers to the similarity between the represented terms.

