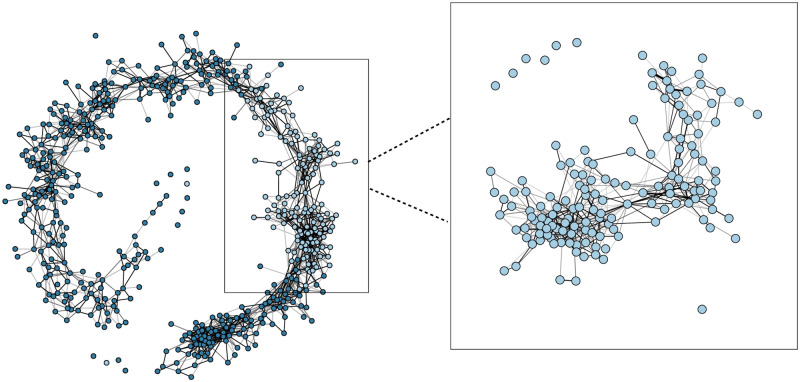
Fig 2. Contact network in the supermarket.
The contact network of n = 624 participants on March 17th is shown on the left. All participants are represented as nodes, and two participants are linked when they came within 1.5 m. The links are weighted by their contact duration. The highlighted nodes indicate the participants present between 15:00 and 16:00, the time slot we selected for the comparison. A detailed view of the contact network of these included participants is shown on the right.

