Figure 5.
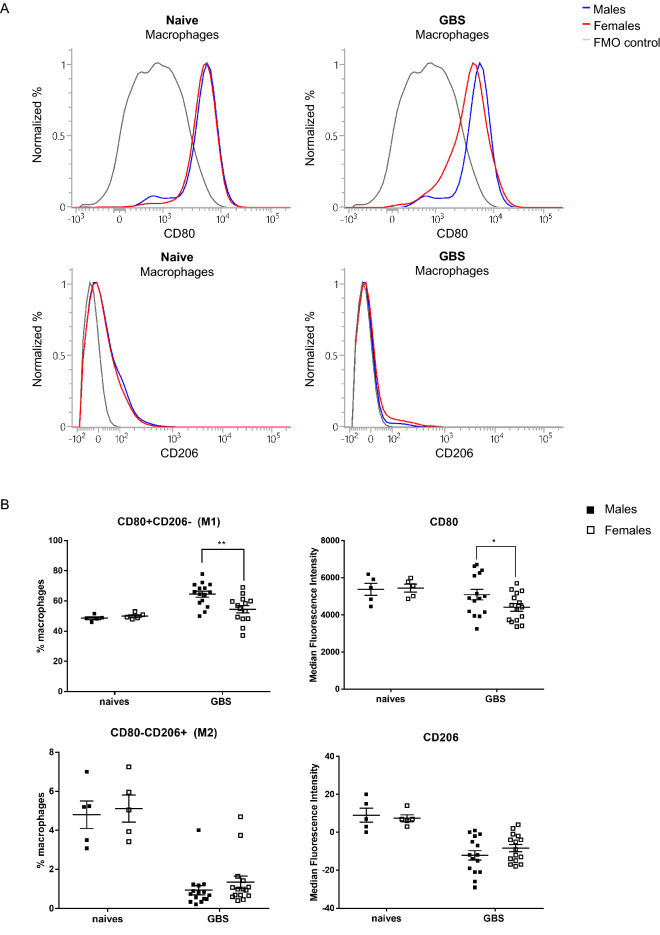
Sex-based analysis of M1 and M2 polarization markers on macrophages at 24 h post GBS lung infection. Male (black) and female (white) C57BL/6 mice were infected intranasally with ± 108 CFU of GBS (n = 15/group). Naive mice were used as controls (n = 5/group). (A) Expression levels of CD80 (M1) and CD206 (M2) were compared by flow cytometry on macrophages (CD45+, CD64+, MHCII+) shown in histograms: blue line represent the fluorescent profile of males; red lines represent the fluorescent profile of females and grey lines represent the fluorescent profile for Fluorescence Minus One (FMO) control. (B) The % of macrophages positive for surface marker CD80 and negative for CD206 (M1) as well as the % of macrophages positive for surface marker CD206 and negative for CD80 (M2) were determined. Evaluation of the mean fluorescence intensity (MFI) for CD80 and CD206 surface marker expression was also analyzed at the macrophage level. *p < 0.05, **p < 0.01 (Mann–Whitney U test). Data are representative of three independent experiments.

