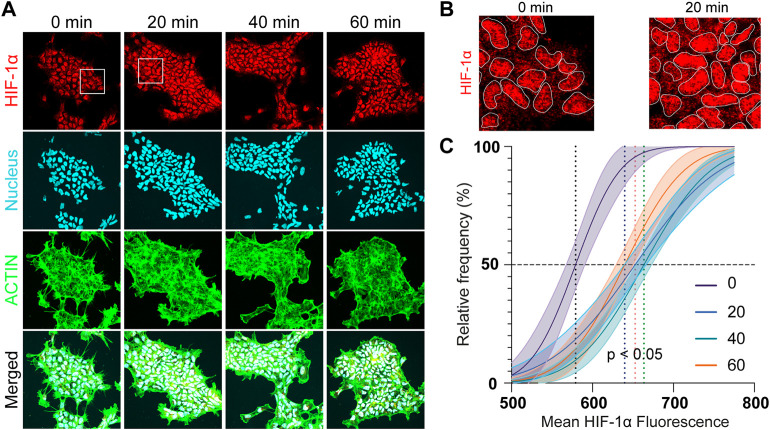
FIGURE 6.
Acute hypoxia of hNPCs. (A) Representative confocal images of hNPCs in acute hypoxia: HIF-1α (red); nucleus (cyan); actin (green). (B) Zoom in of the confocal images for comparison. (C) Frequency distribution analysis of the mean HIF-1α intensity in the cells under different hypoxia durations.

