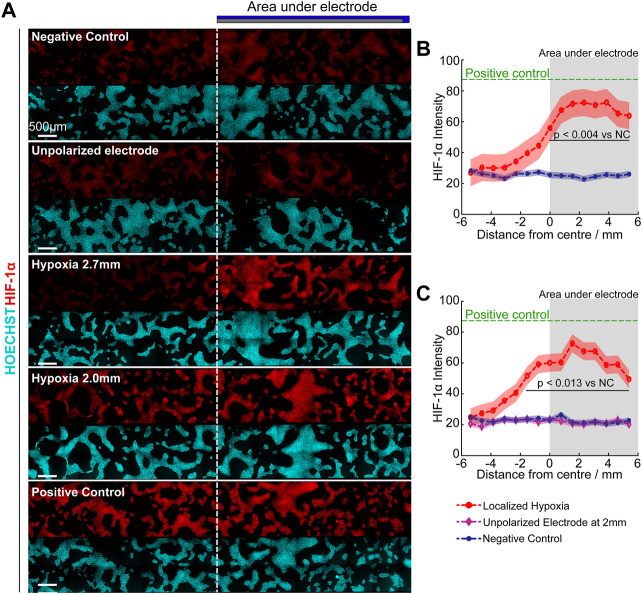
FIGURE 8.
Focal hypoxia in a well. (A) Confocal images of cultures under different hypoxia conditions. Dotted line indicates the border of the electrode. (B,C) Quantitative analysis of mean HIF-1α intensity (curve) ± standard deviation (shaded region) across the base under 2.7 mm (B) and 2.0 mm (C) height of scavenging electrode, analysed with Tukey multiple comparison. Green: Positive control (250 µM DMOG); Red: Scavenging electrode polarized; Purple: Scavenging electrode unpolarized; Blue: Negative control. Grey shaded area indicates regions under oxygen scavenging electrode.

