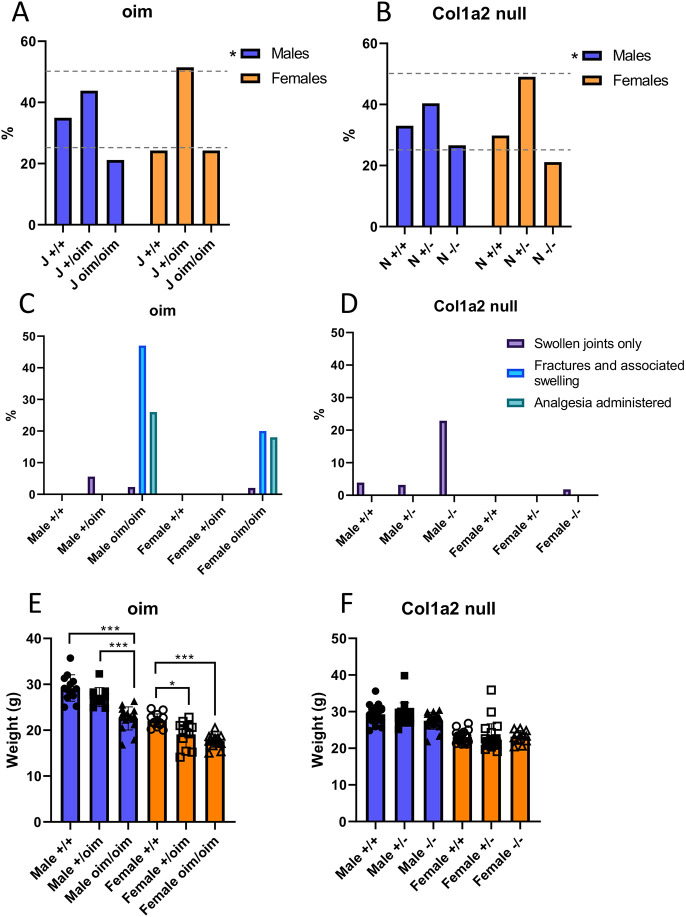
Fig. 2.
Inheritance pattern, musculoskeletal health summary and mouse weights for the oim and Col1a2 null lines. (A,B) The percentage of mice of each genotype born to heterozygous parents and determined at weaning for the oim (A) and Col1a2 null (B) lines. A chi-squared test showed significant differences between observed inheritance and expected Mendelian inheritance (25%, 50%, 25%; dashed grey lines) for male mice of both lines (*P<0.05). (C,D) The numbers of mice suffering from swollen joints and bone fractures, including those treated with analgesics, were recorded for the oim (C) and Col1a2 null (D) lines. These numbers are expressed as a percentage of total mouse numbers. A-D: n=71, n=89 and n=43 for male oim +/+, +/oim and oim/oim mice, respectively; n=50, n=106 and n=50 for female oim +/+, +/oim and oim/oim mice, respectively; n=103, n=126 and n=83 for male Col1a2 null +/+, +/−, −/− mice, respectively; and n=79, n=130, n=56 for female Col1a2 null +/+, +/−, −/− mice, respectively. Swollen joints were mild in the Col1a2 null line and often not noted until advanced age; therefore, the numbers shown above may be an underestimation due to many mice being culled at earlier time points. (E,F) Weights of 18-week-old oim (E) and Col1a2 null (F) mice measured after euthanasia. Blue bars/filled shapes, males; orange bars/open shapes, females. *P<0.05 and ***P<0.001 (one-way ANOVA within sexes). E: P-value for genotype <0.001 for males and females. E,F: n=13, n=11 and n=16 for male oim male +/+, +/oim and oim/oim mice, respectively; n=13, n=12 and n=15 for female oim +/+, +/oim and oim/oim mice, respectively; n=21, n=17 and n=17 for male Col1a2 null +/+, +/−, −/− mice, respectively; and n=21, n=22, n=12 for female Col1a2 null +/+, +/−, −/− mice, respectively. Bars show mean±s.d.

