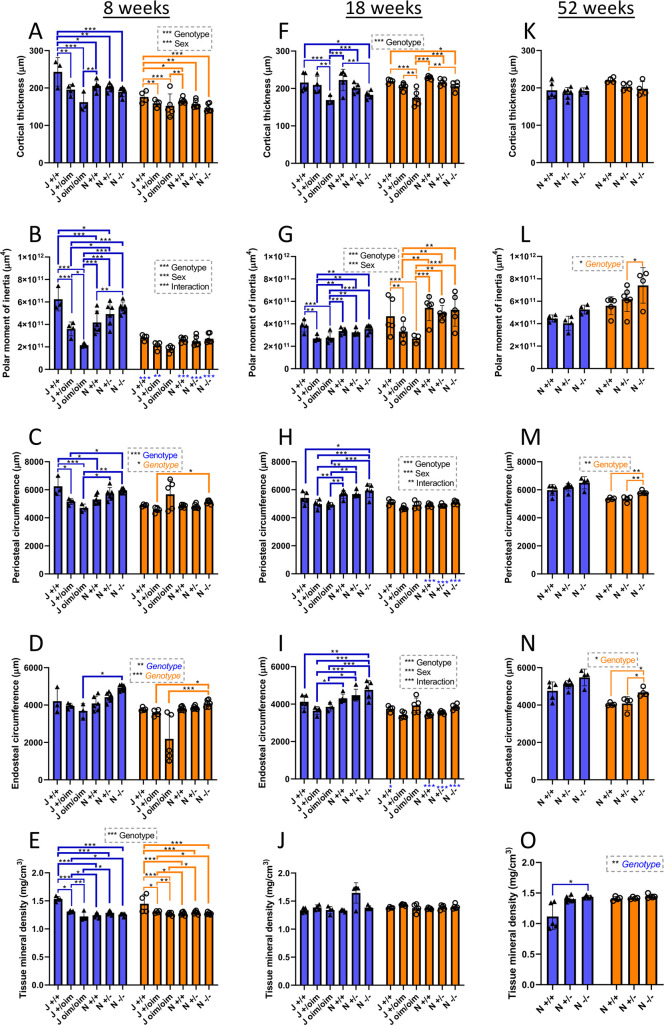
Fig. 3.
Femoral cortical bone analyses of oim and Col1a2 null mice. (A-O) Micro-computed tomography (μCT) scans were performed on the femur of oim and Col1a2 null mice at 8 (A-E), 18 (F-J) and 52 (K-O) weeks. Reconstruction and analysis of scan files enabled determination of cortical thickness (A,F,K), polar moment of inertia (B,G,L), periosteal (C,H,M) and endosteal (D,I,N) circumference, as well as bone density (E,J,O). Blue bars/triangles, males; orange bars/circles, females. Blue (male) and orange (female) brackets show differences between genotypes. Male/female differences for particular genotypes are shown below the x-axis for females (blue stars). *P<0.05, **P<0.01 and ***P<0.001 [two-way, one-way (significant factors denoted in coloured font) or non-parametric (significant factors denoted in italicised font) ANOVA]. n=3 for male oim groups at 8 weeks, except for +/oim and bone density measurements where n=4. n=4 for female oim groups at 8 weeks, except for oim/oim where n=5. n=3 for male oim/oim at 18 weeks, except for bone density where n=4. n=4 for male oim/oim and female +/+; n=5 for other oim groups at 18 weeks. n=6 for all Col1a2 null groups at 8 weeks and n=5 for all Col1a2 null groups at 18 weeks. n=4 for all Col1a2 null groups at 52 weeks, except male +/+ where n=5 and +/− where n=6. Bars show mean±s.d.

