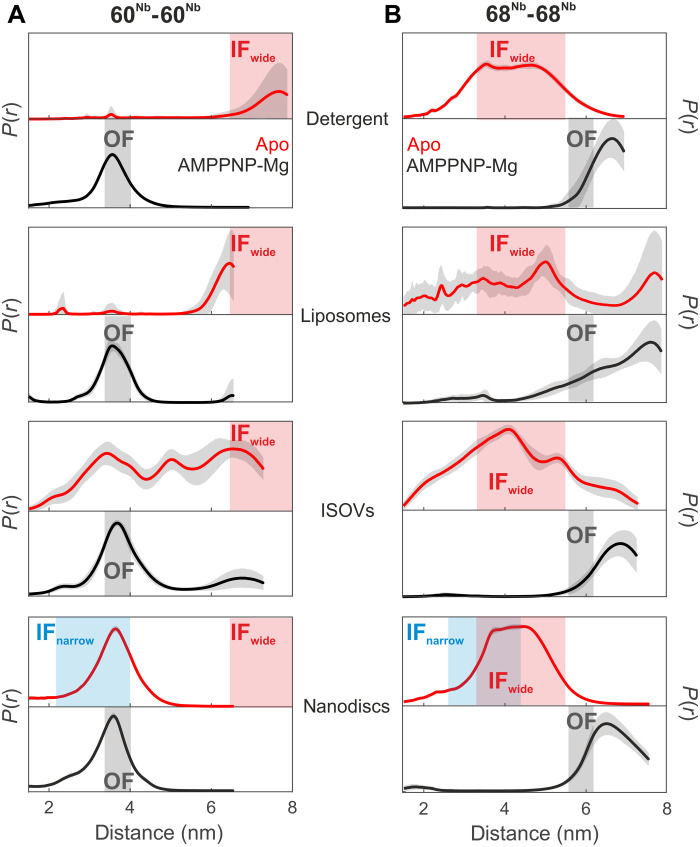
Fig. 2. Nanobody-assisted DEER analysis of MsbA embedded in different environments.
Internanobody distance distributions between pairs 60Nb-60Nb (A) and 68Nb-68Nb (B) measured in the indicated environment in the absence of nucleotides (apo state, red curves) or in the presence of AMPPNP-Mg (black curves). Uncertainties estimated from the neural network analysis are shown as gray contour of the distributions. The blue and gray shaded areas are interspin distances including error margins obtained from the cryo-EM structures of IFnarrow and OFoccluded, respectively (from Fig. 1, A to D). The red shaded areas represent the range of expected interspin distances predicted using a rotamer approach for IFwide (PDB: 3B5W; see Fig. 1E). The distances in nanodiscs correspond to a biological repeat different from that shown in Fig. 1. Primary DEER data are shown in fig. S9.

