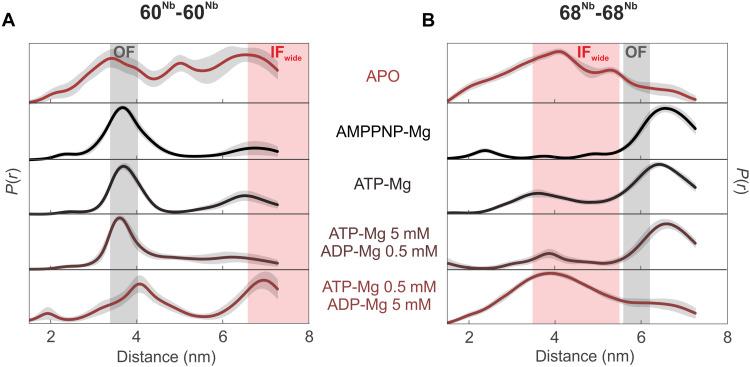
Fig. 3. DEER analysis of MsbA under ATP turnover conditions in inside-out vesicles from E. coli.
Distance distributions of the inter-nanobody distances for the 60Nb-60Nb pair (A) and 68Nb-68Nb pair (B) in ISOVs overexpressing WT MsbA under apo, AMPPNP-Mg, or ATP turnover conditions. The gray shaded areas represent the distance range of the OFoccluded conformation, estimated on the basis of the cryo-EM structures, and the red shaded areas correspond to the distance range predicted for the IFwide conformation using a rotamer approach (see Fig. 1). The apo and AMPPNP-Mg data are the same as shown in Fig. 2.

