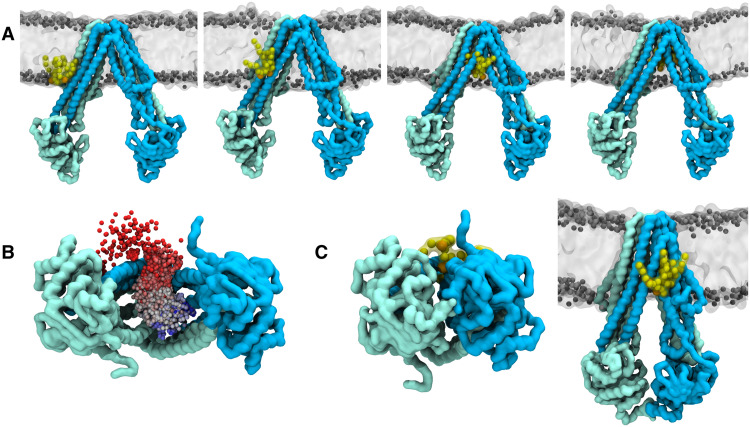
Fig. 5. Binding of core lipid A inside the TMD cavity of IFwide.
(A) Shown are snapshots from a representative coarse-grained MD simulation of the IFwide conformation. The MsbA chains are colored as in Fig. 1. The lipid A molecule that binds inside MsbA is shown in yellow with the phosphate beads in orange. The bilayer lipids are shown in gray; solvent molecules are not shown for clarity. (B) Binding pathway of lipid A to the MsbA TMD cavity viewed from the cytosol. The dots represent the position of the phosphate groups in the lipid A headgroup and are colored from red to blue as a function of the simulation time to show the entrance pathway. Similar lipid A entry pathways were found in four independent repeat simulations (each 50 μs long), whereas lipid A did not enter into the TMD cavity in the corresponding simulations of IFnarrow. (C) Left: Shown is the last snapshot from one of the simulations of the IFnarrow conformation viewed from the cytosol with a lipid A molecule located next to one of the lateral portals. Right: The same snapshot viewed from the side.

