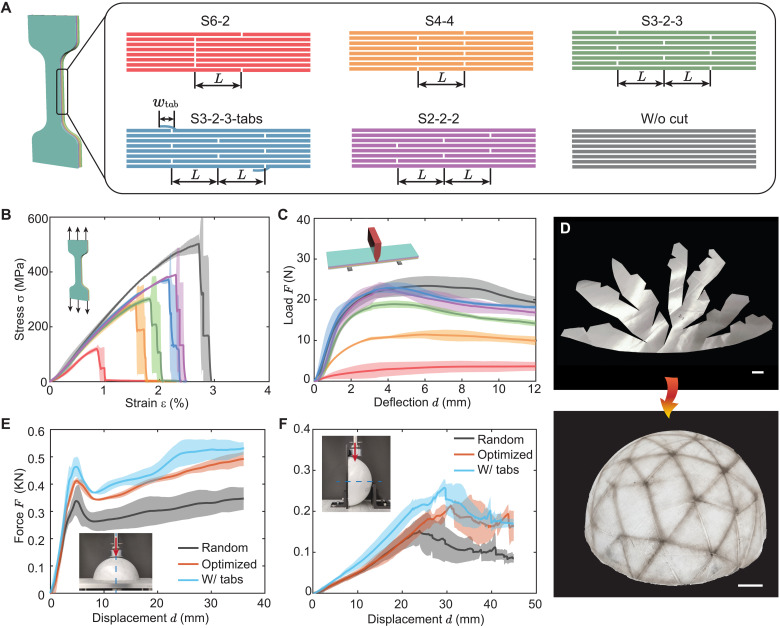
Fig. 3. Experimental validations for 2D and 3D structures with different layups.
(A) 2D specimens of different cut distributions. Each specimen consists of eight plies with varying cut positions. S6-2 denotes six and two cuts overlapped at two positions. The same notion applies to others, and the distance between cuts is L = 25 mm. (B) Experimental stress-strain curves for the dog bone specimens under uniaxial tensile tests and (C) load-deflection curves for the rectangular specimens under three-point bend tests. The color of each line corresponds to that shown in (A). (D) Experimental snapshots of a cut ply and a consolidated hemisphere with the optimized layup fabricated from Tensylon HSBD30A. Scale bars, 20 mm. (E and F) Force-displacement curves of the hemispherical samples with different layups when compressed (E) along the axial direction and (F) perpendicularly to the axial direction of the shells. Shaded areas indicate the SD of the measurements.

