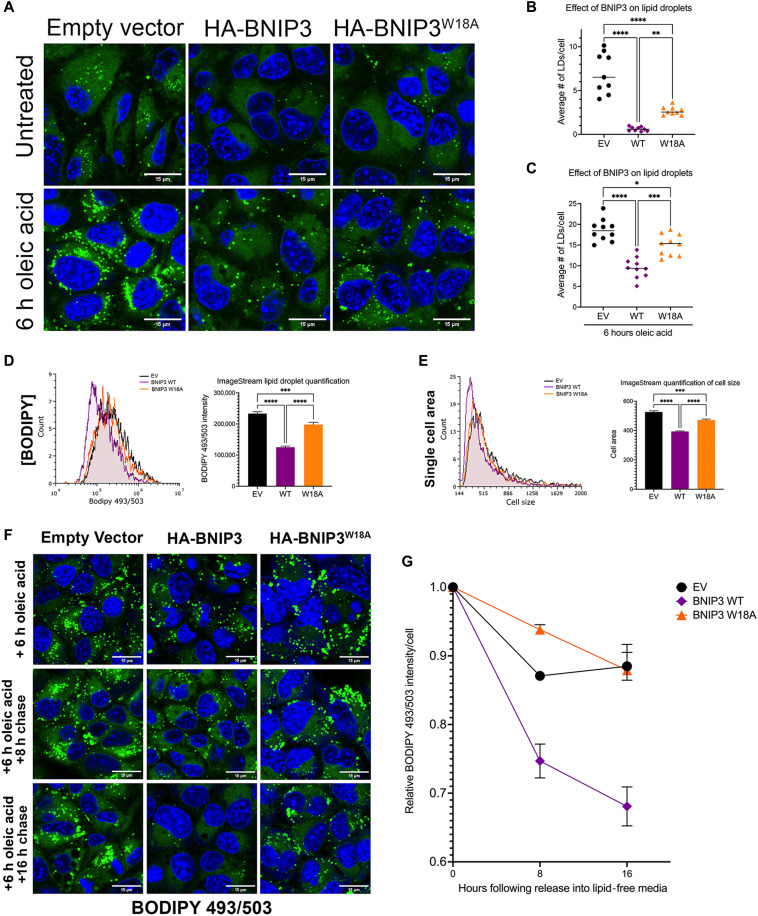
Fig. 4. BNIP3 suppresses LD accumulation in HCC cells.
(A) LD staining (BODIPY 493/503) in bnip3−/− HCC cells reconstituted with EV, HA-BNIP3WT, or HA-BNIP3W18A ± 100 μM oleic acid. (B) Graph of BODIPY 493/503 staining in bnip3−/− HCC cells reconstituted with EV, HA-BNIP3WT, or HA-BNIP3W18A (***P < 0.001; ****P < 0.0001; at least 20 cells per field, each data point is one field, n ≥ 10 fields per condition). (C) Graph of BODIPY 493/503 staining in bnip3−/− HCC cells reconstituted with EV, HA-BNIP3WT, or HA-BNIP3W18A + oleic acid (***P < 0.001; ****P < 0.0001; at least 20 cells per field, each data point is one field, n ≥ 10 fields per condition). (D) Quantification of BODIPY 493/503 ImageStream flow cytometric analysis of bnip3−/− HCC cells reconstituted with EV, HA-BNIP3WT, or HA-BNIP3W18A (***P < 0.001 and ****P < 0.0001; at least 10,000 cells per condition were quantified for n = 2 experiments). (E) Quantification of cell size generated by ImageStream flow cytometric analysis of bnip3−/− HCC cells reconstituted with EV, HA-BNIP3WT, or HA-BNIP3W18A (***P < 0.001 and ****P < 0.0001; at least 10,000 cells per condition were quantified for n = 2 experiments). (F) Lipid droplet staining (BODIPY 493/503) in bnip3−/− HCC cells reconstituted with EV, HA-BNIP3WT, or HA-BNIP3W18A grown for 6 hours in 100 μM oleic acid and then released into lipid-free media for 0, 8, and 16 hours. (G) ImageStream flow cytometric quantification of relative numbers of LDs in bnip3−/− HCC cells reconstituted with EV, HA-BNIP3WT, or HA-BNIP3W18A grown for 6 hours in 100 μM oleic acid and then released into lipid free–media for 0, 8, and 16 hours (at least 10,000 cells per condition were quantified for n = 2 experiments).

