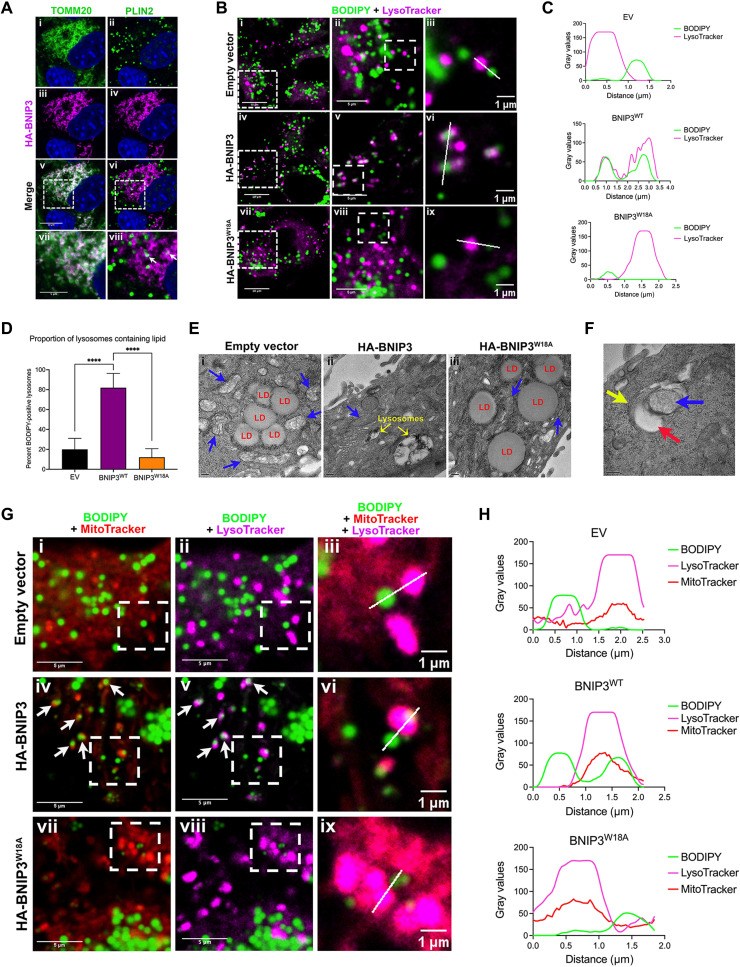
Fig. 6. BNIP3 promotes LD-lysosome interactions at mitochondria.
(A) Fluorescent microscopy of bnip3−/− HCC cells expressing HA-BNIP3WT, stained for HA-BNIP3 (magenta) and TOMM20 or PLIN2 (green) to assess overlap (white, arrows in viii). White dashed square indicates area magnified below. (B) Fluorescent microscopy of bnip3−/− HCC cells expressing EV, HA-BNIP3WT, or HA-BNIP3W18A grown in 50 μM LALi + 100 μM oleic acid, stained with BODIPY 493/503 and LysoTracker to visualize overlap (white) between LDs (green) and lysosomes (magenta). (C) Linescan analysis colocalizing LDs with lysosomes from (B, iii, vi, and ix) from bnip3−/− HCC cells expressing EV, HA-BNIP3WT, or HA-BNIP3W18A, showing only BNIP3WT-promoted LD-lysosome overlap. (D) Quantification of percent BODIPY-positive lysosomes/cell for bnip3−/− HCC cells expressing EV, HA-BNIP3WT, or HA-BNIP3W18A [****P < 0.0001; >2 regions of interest (ROIs)/field, each data point is one ROI, n ≥ 10 fields/condition]. (E) TEM on bnip3−/− HCC cells expressing EV, HA-BNIP3WT, or HA-BNIP3W18A + 50 μM LALi + 100 μM oleic acid (red: LDs; blue: mitochondria; yellow: lysosomes). Scale bars, 200 nm (bottom left). (F) TEM on bnip3−/− HCC cells expressing HA-BNIP3WT + 50 μM LALi + 100 μM oleic acid (red: LDs; blue: mitochondria; yellow: lysosomes). Scale bar, 200 nm (bottom left). (G) Fluorescent microscopy of bnip3−/− HCC cells expressing EV, HA-BNIP3WT, or HA-BNIP3W18A grown in 50 μM LALi + 100 μM oleic acid, stained with BODIPY 493/503 (green), MitoTracker (red), and LysoTracker (magenta). Arrows point to areas of overlap between mitochondria and LDs (iv) and lysosomes with LDs (v), consistent with colocalization of LDs, mitochondria, and lysosomes. (H) Linescan analysis colocalizing LDs, mitochondria, and lysosomes in bnip3−/− HCC cells expressing EV, HA-BNIP3WT, or HA-BNIP3W18A in (F, iii, vi, ix), showing that only BNIP3WT promoted LD-mitochondria-lysosome overlap.

