Fig. 1.

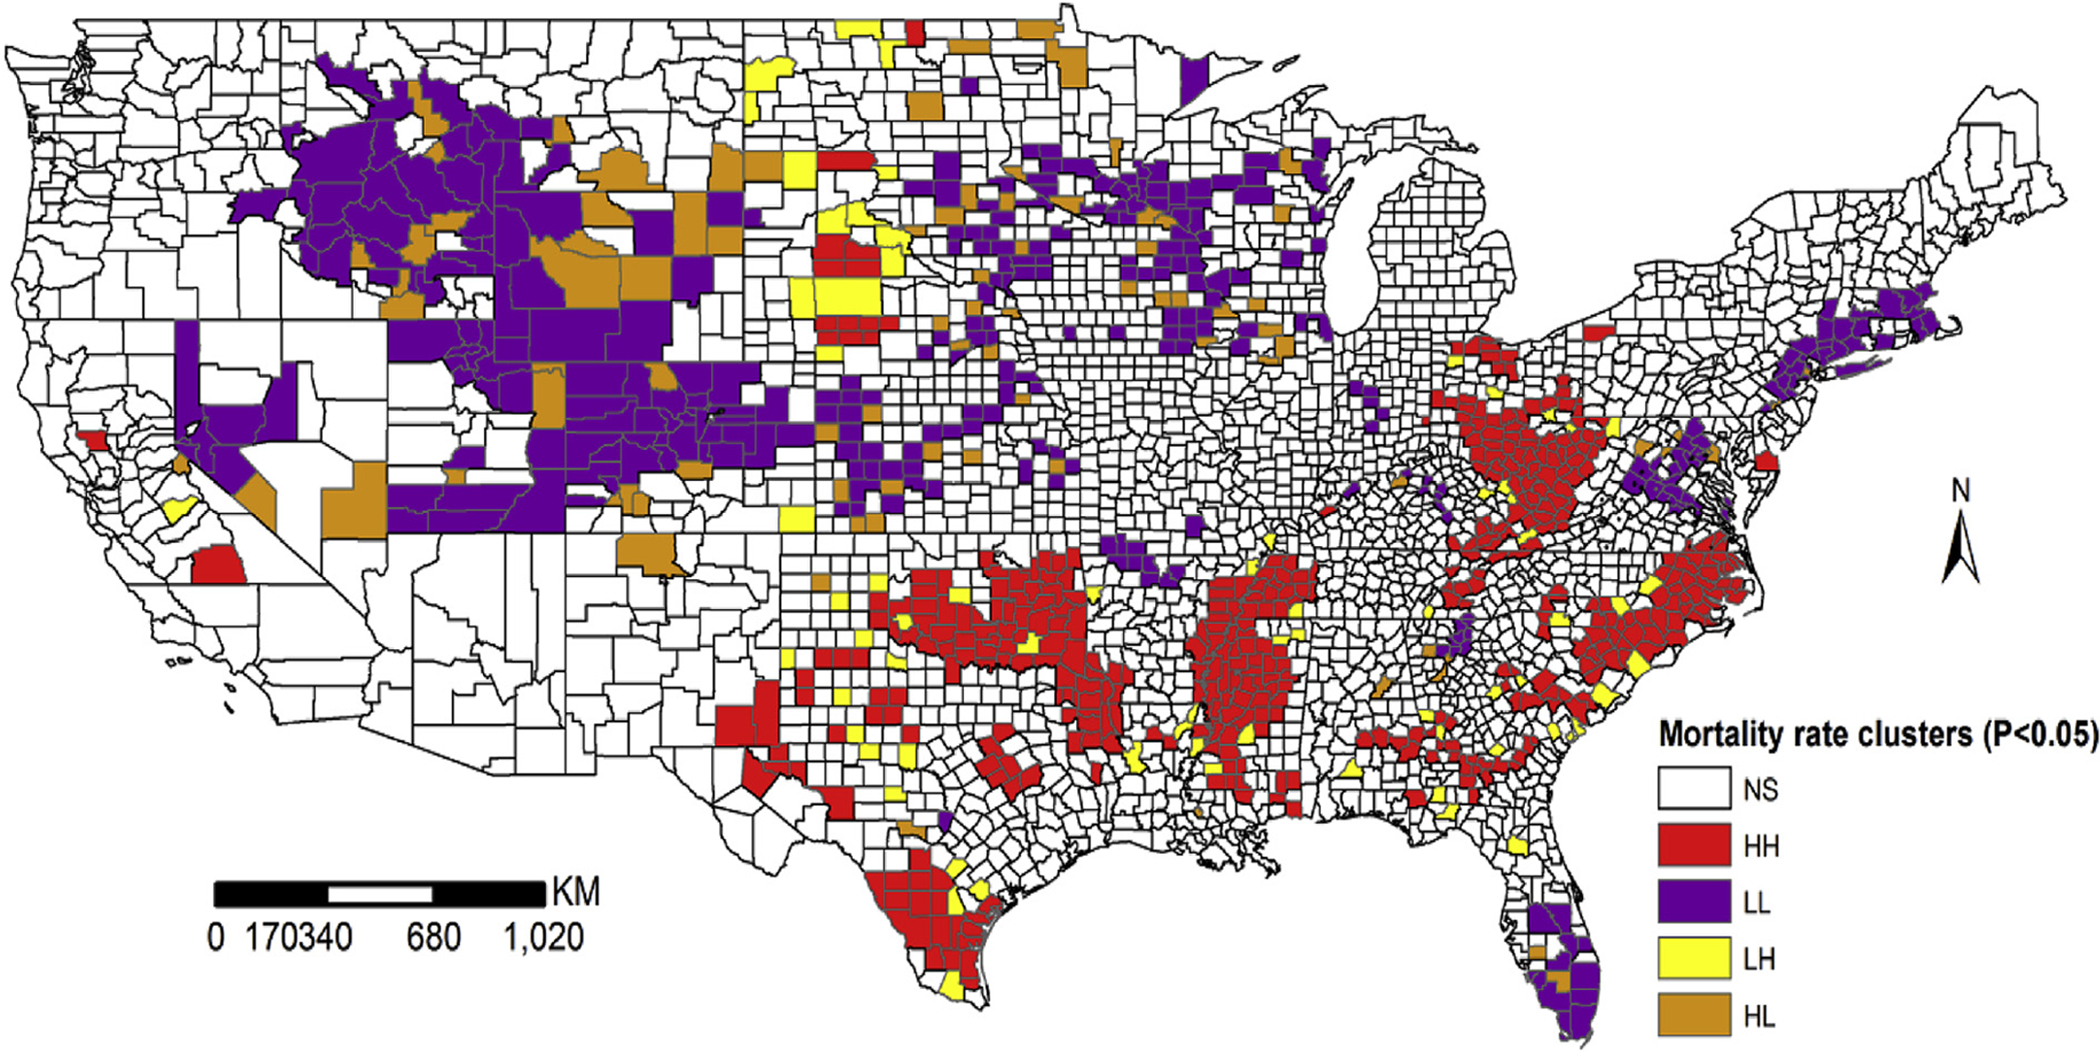
Spatial cluster of diabetes-related mortality rate (DRMR) in contiguous US counties. NS = non-significant, HH = high-high clusters, LL = low-low clusters, LH = low-high clusters and HL = high-low clusters.

Spatial cluster of diabetes-related mortality rate (DRMR) in contiguous US counties. NS = non-significant, HH = high-high clusters, LL = low-low clusters, LH = low-high clusters and HL = high-low clusters.