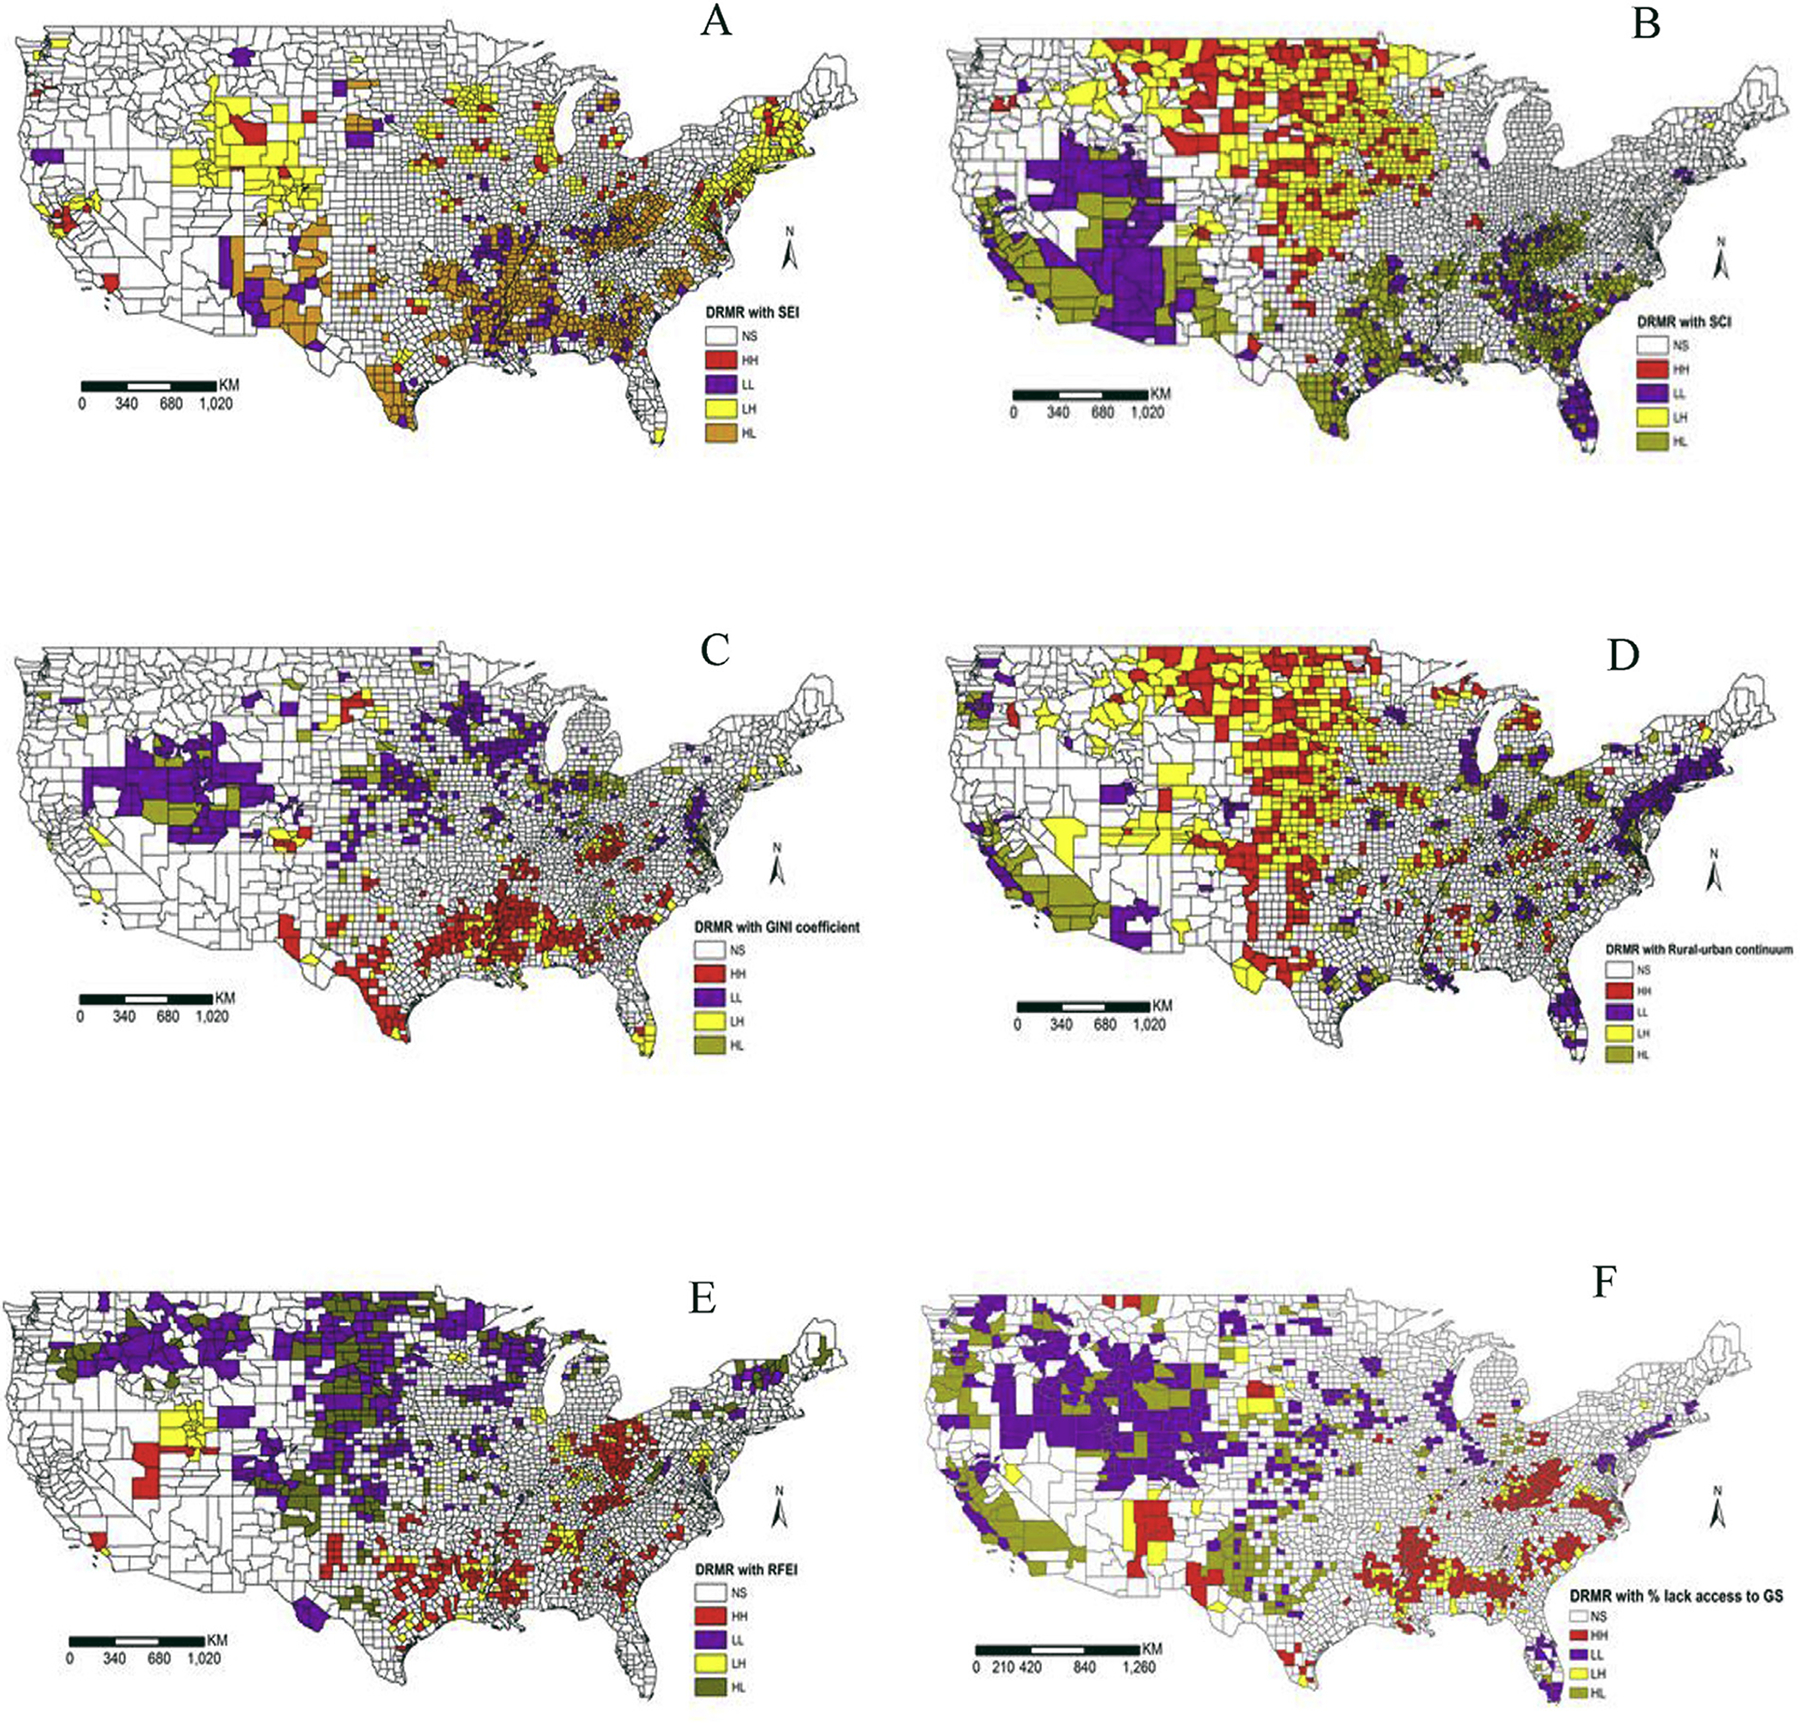
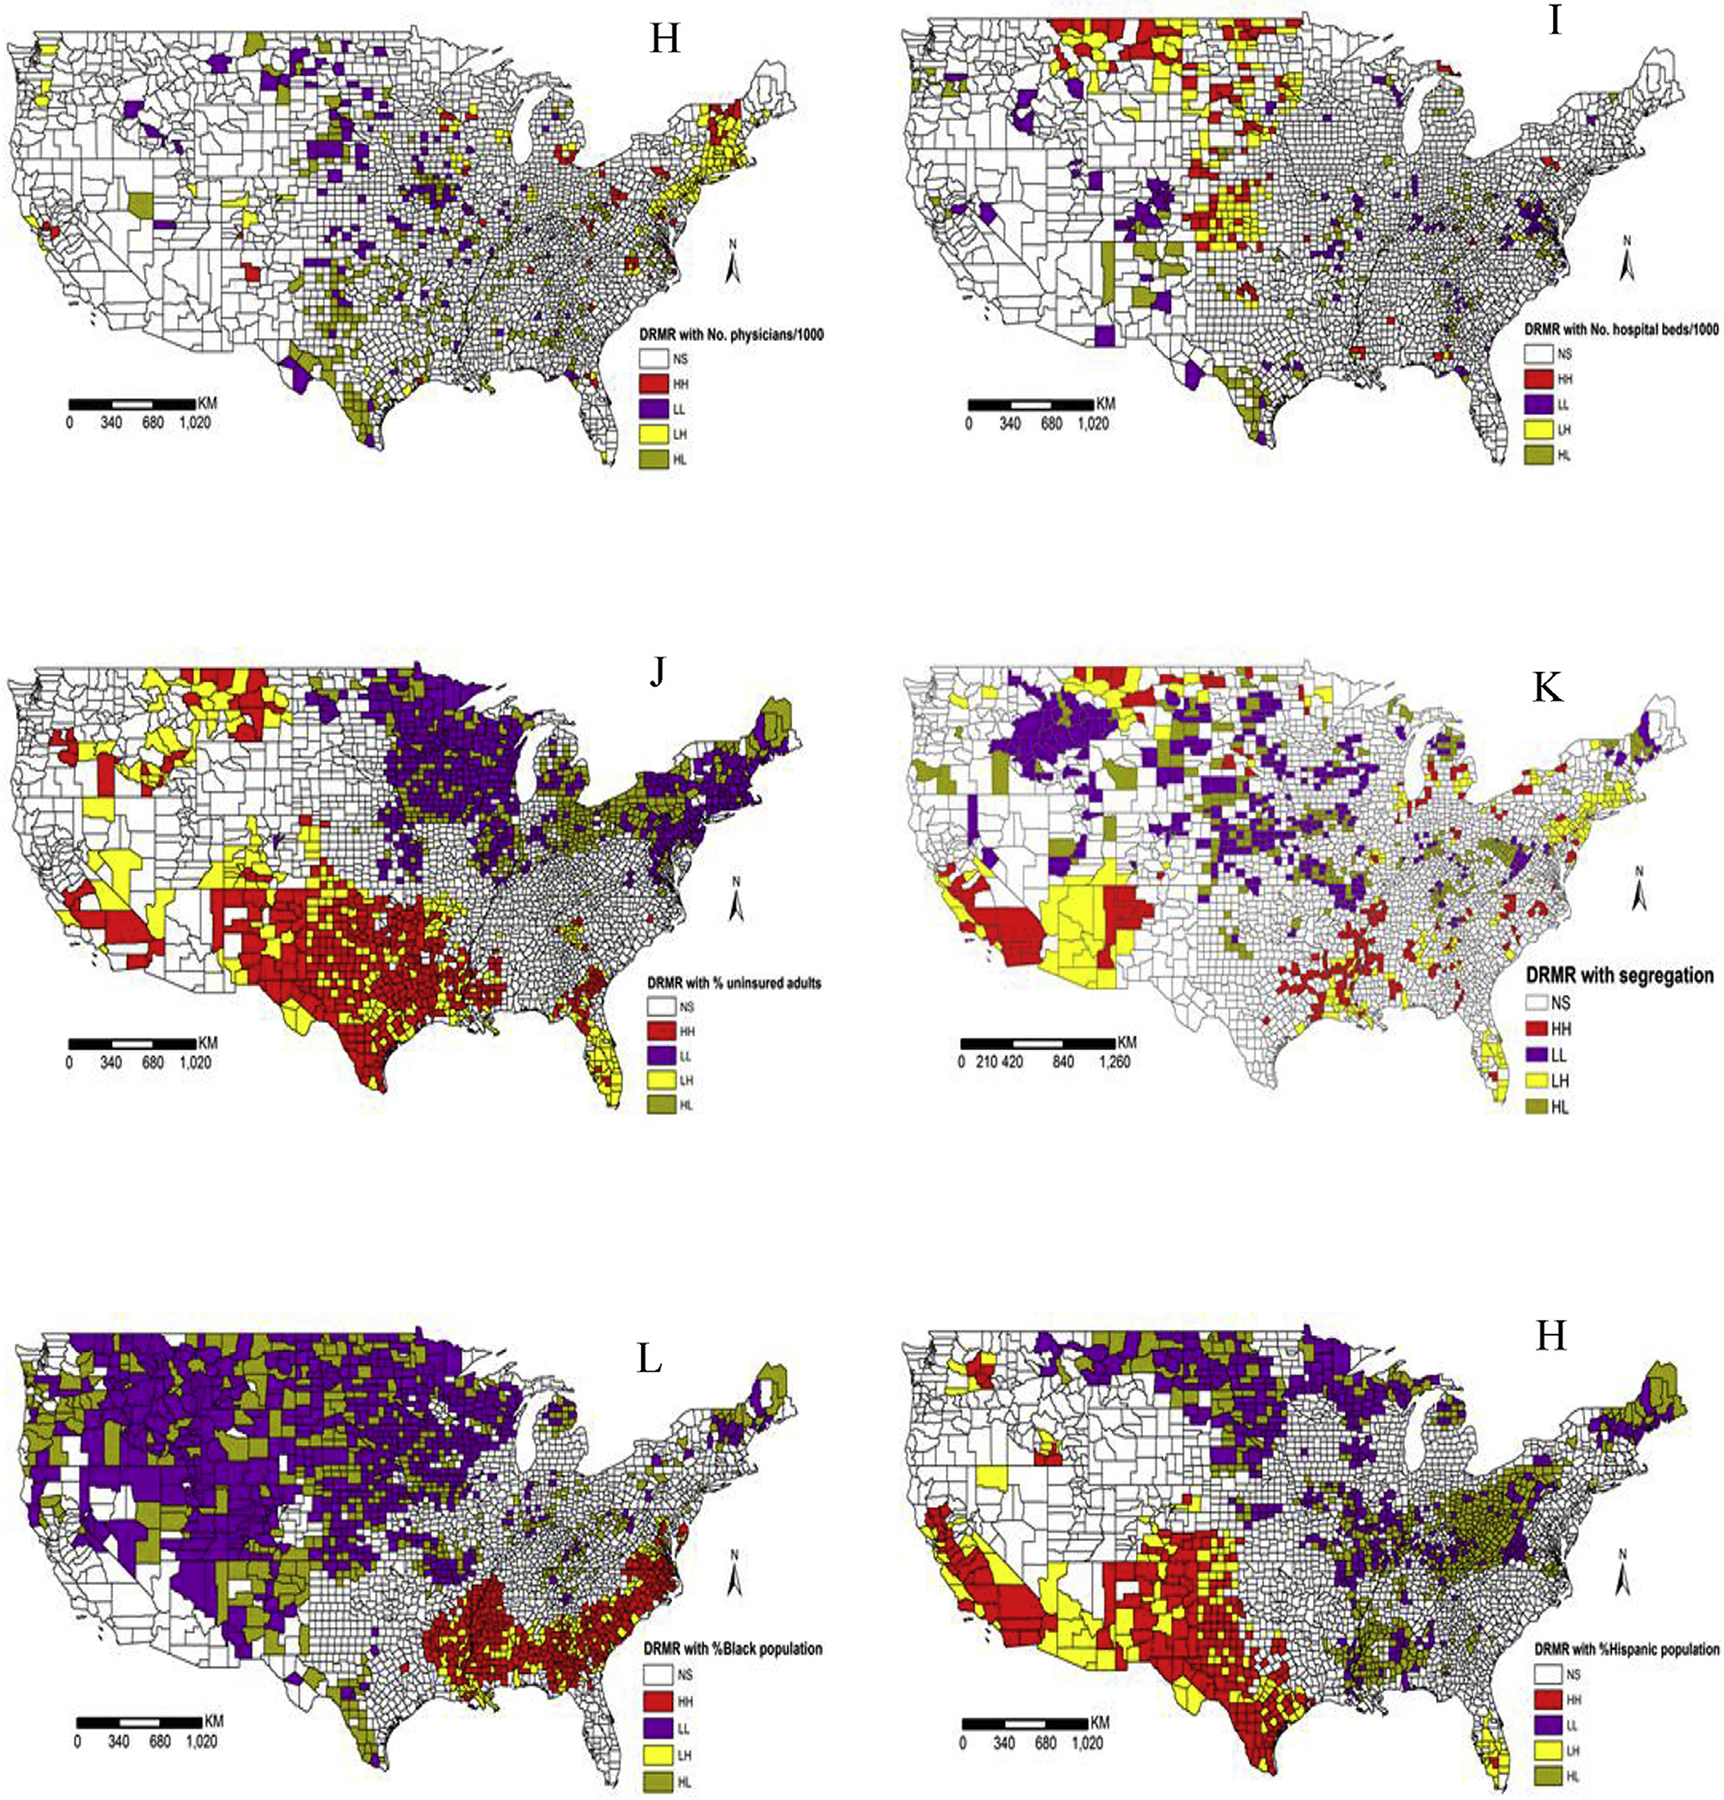
Fig. 2.


(2a). Bivariate LISA cluster map for DRMR and neighboring county (A) Socioeconomic index (SEI), (B) Social capital index (SCI), (C) Income disparity (Gini coefficient), (D) Proportion of urban resident, (E) Retail food environment index (RFEI), and (F) Proportion of households who lack access to grocery stores. NS = non-significant, HH = high-high clusters, LL = low-low clusters, LH = low-high clusters and HL = high-low clusters. (2b). Bivariate LISA cluster map for DRMR and neighboring county (H) medical doctor’s density, (I) hospital beds density, (J) proportion of uninsured residents, (K) spatial proximity index (SPI) for segregation, (L) proportion of Black population, and (M) proportion of Hispanic population. NS = non-significant, HH = high-high clusters, LL = low-low clusters, LH = low-high clusters and HL = high-low clusters.
