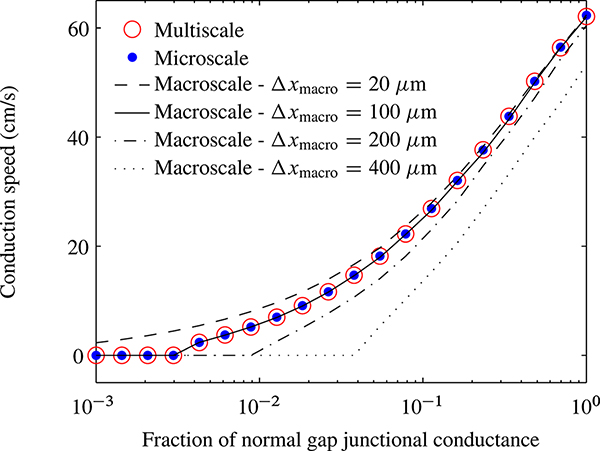
Figure 4.7.
Conduction speed along different models of a linear strand of myocytes without ephaptic coupling (Rc = 0) as a function of the gap-junctional coupling strength gGJ. The multiscale model reproduces the dynamics of the underlying microscale model across the entire range of values of gGJ surveyed. In particular, notice that the multiscale model captures the level of gap-junctional coupling that yields propagation failure in the microscale model. By contrast, the macroscale model predicts substantially different values of gGJ that lead to propagation failure for different numerical grid spacings. In particular, coarse macroscale grid spacings yield a model that predicts propagation failure at substantially higher levels of gap-junctional coupling than the micro- and multiscale models, and fine macroscopic grid spacings yield propagation success for substantially smaller values of gGJ. It is interesting to note that if the macroscopic grid spacing is equal to the cell size (100 μm), then the macroscopic model is in perfect agreement with the micro- and multiscale models. Figure from Hand and Griffith [29].

