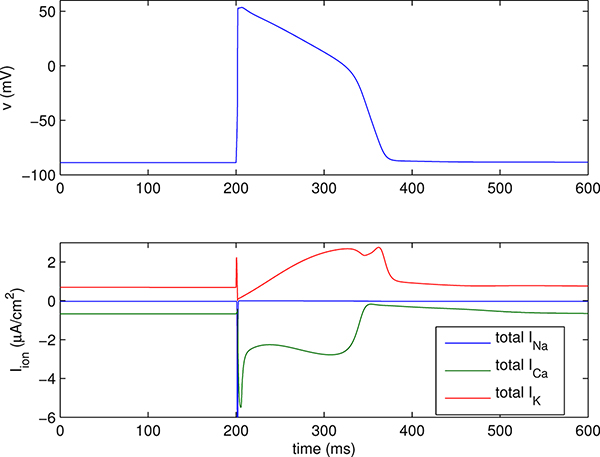
Figure 3.1.
Action potential generated by a version of the Luo-Rudy ventricular cell model [19]. The upper panel shows the transmembrane voltage, and lower panel shows the transmembrane ionic currents. The plotted current is the total for each ion species; the different currents of the model carried by any one ion species have been lumped together here to avoid making the plot too complicated. Note that the (negative) peak of the Na+ current is about −500 μA/cm2, which is much too large in magnitude to appear on the scale of the plot.

