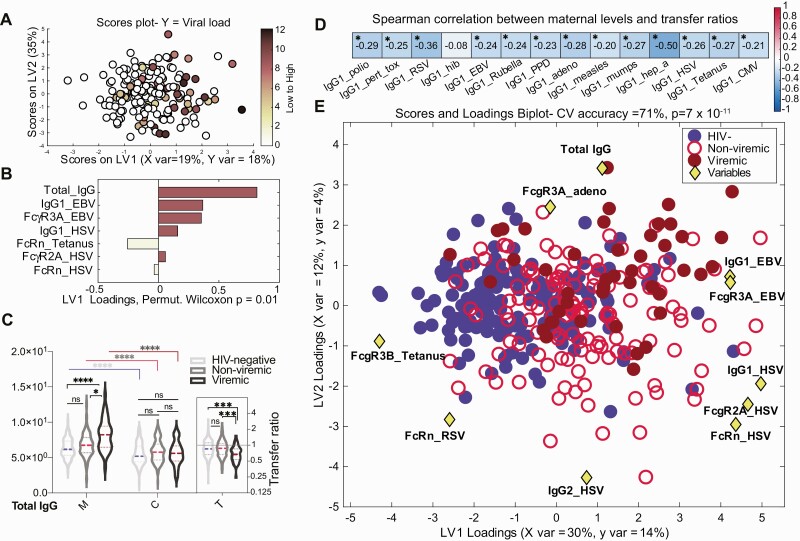
Figure 4.
The contribution of maternal human immunodeficiency virus (HIV) viremia to perturbed maternal antibody profiles. A and B, Multivariate analysis to identify maternal antibody features associated with high maternal HIV viral load. A, Features predictive of maternal HIV viral load defined using orthogonalized partial least squares discriminant analysis model. Dots represent individual women with HIV (WHIV) and are colored based on HIV viral load (darker = higher, colorless = undetectable). Correlates of high HIV viral load are captured on latent variable 1 (LV1), explaining 18% of the variance in viral load. This model outperformed >99% of random models (cross-validation [CV] Wilcoxon P = .008). B, Bar graph depicting the loading plot associated with maternal HIV viral load, where maternal antibody and receptor features were ranked based on their variable importance in projection (VIP) score, representing each feature’s contribution to viral load. Total immunoglobulin G (IgG) is the only feature with VIP score >1, signifying greater than average contribution to the variation in viral load. C, Violin plots show the distribution of total IgG in maternal (M) and umbilical cord (C) plasma grouped by maternal viremia status. The inset (T) depicts total IgG transfer ratios. Significance was evaluated by a Kruskal-Wallis test corrected for multiple comparisons using a Dunn test, where adjusted P < .033 was considered significant. *P < .033, ***P < .0002, ****P < .0001. D, Spearman correlation of maternal plasma levels with corresponding transplacental transfer ratios for 14 antigen-specific IgG1 levels, calculated across all participants. False discovery rate–adjusted P values. *P < .05 was considered significant. E, Multivariate analysis of maternal features associated with HIV viremia. Using the combined set of 12 features that separated pairwise profiles of HIV-uninfected, nonviremic WHIV, and viremic WHIV, a 3-way partial least squares discriminant analysis (PLSDA) summarizing the comparison of HIV-uninfected (n = 173, blue filled circles), nonviremic WHIV (n = 131, red open circles), and viremic WHIV (n = 45, dark red filled circles) individuals. The PLSDA biplot depicts score plots of individuals color-coded based on their HIV serostatus and HIV viremia group, which was overlaid on the 2-dimensional loading plots of the 12 input features (yellow diamonds). LV1 accounts for 30% of variance in X and 14% of variance in Y, whereas latent variable 2 explains 12% X variance and 4% Y variance. Five-fold cross validation resulted in 70% CV accuracy. Permutation testing results showed that this model significantly outperformed models based on shuffled group labels (Wilcoxon P < 10–10). This biplot could be interpreted as the yellow diamonds “pulling” individual participants in their respective directions. Abbreviations: adeno, adenovirus; CV, cross-validation; EBV, Epstein-Barr virus; FcR, Fc receptor; HIV, human immunodeficiency virus; HSV, herpes simplex virus; IgG, immunoglobulin G; LV, latent variable; ns, not significant; RSV, respiratory syncytial virus.

