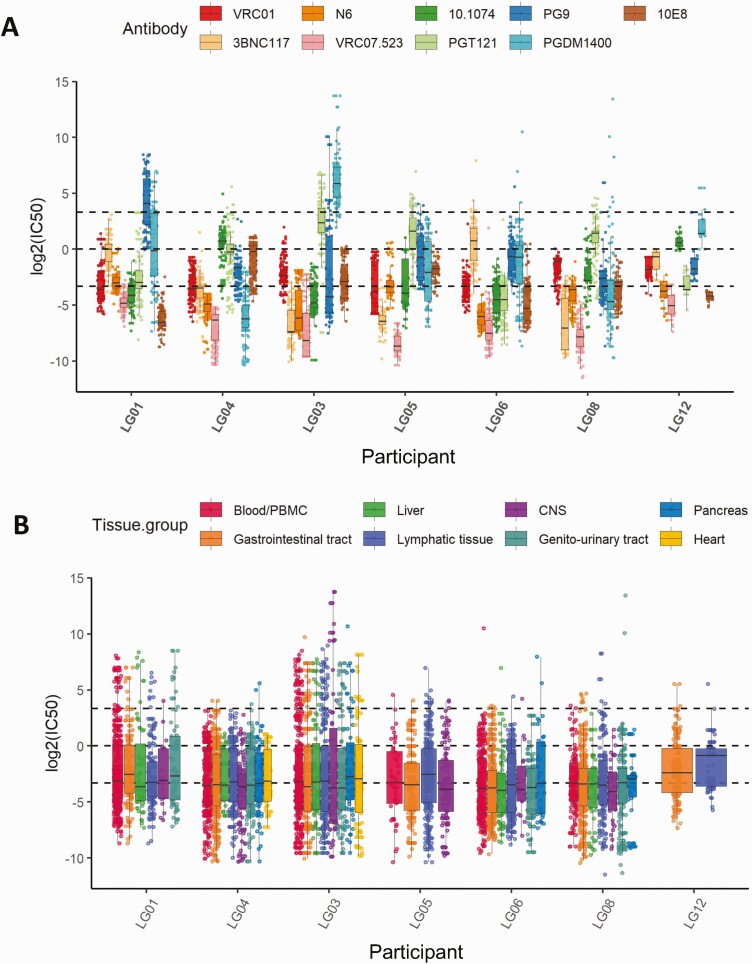
Figure 2.
A, The heterogeneity of neutralization susceptibilities for individual broadly neutralizing antibodies (bNAbs) across all tissues per participant. B, The homogeneous distribution of predicted neutralization in different tissue compartments for each participant across all bNAbs. The box plots show the median values with the first and third quartiles across the bNAbs and tissues. The dashed lines from bottom to top denote half-maximal inhibitory concentrations (IC50) = 0.1 µg/mL, IC50 = 1 µg/mL, and IC50 = 10 µg/mL. Abbreviations: CNS, central nervous system; PBMC, peripheral blood mononuclear cell.

