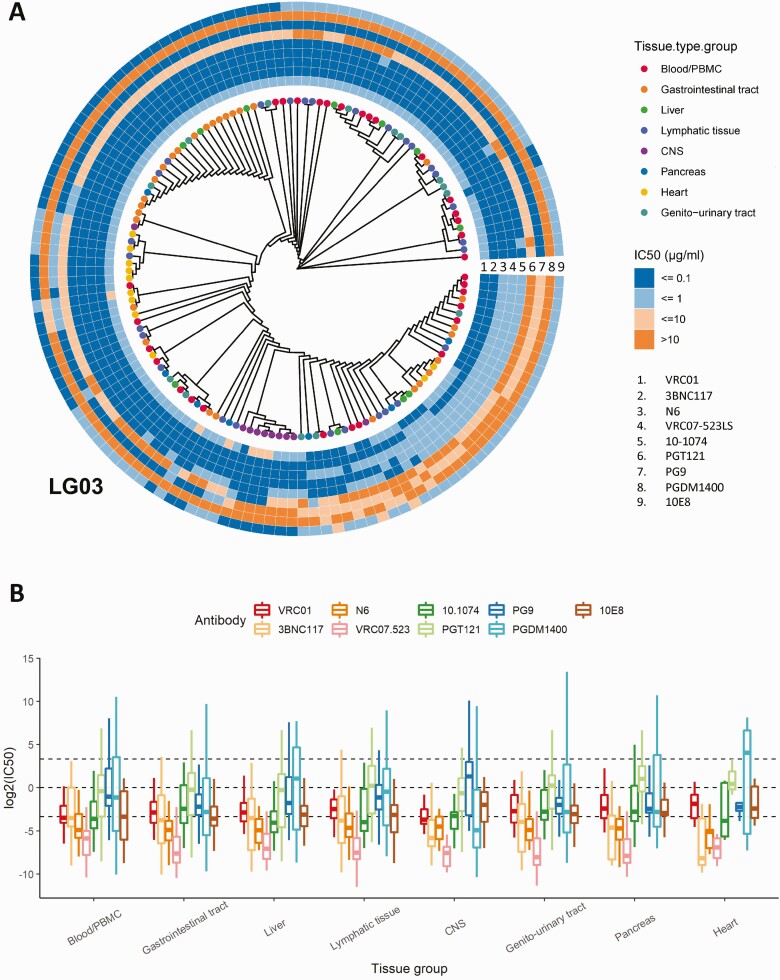
Figure 3.
A, Maximum likelihood phylogeny for participant LG03. Tips are colored by tissue compartment as in the legend, and each sequence is paired with the predicted half-maximal inhibitory concentration (IC50) value range information for the 9 tested broadly neutralizing antibodies (bNAbs). The tree has been modified to allow for better visualization by displaying tree topology without branch length information. IC50 values are color coded in 4 groups (≤0.1 µg/mL to >10 µg/mL), and each ring represents a separate bNAb (1 through 9) as per the legend. See also Supplementary Figure 5 for data on the remaining participants. B, The heterogenous distribution of predicted neutralization in different tissue compartments for the selected 9 bNAbs. The box plots show the median values with the first and third quartiles across the bNAbs. Abbreviations: CNS, central nervous system; PBMC, peripheral blood mononuclear cell.

