. 2022 Sep 16;11:e80015. doi: 10.7554/eLife.80015

Figure 6. Tracking single neuron response gain dynamics over a several week period before and after noise exposure.

(A) Example fields-of-view from a single mouse showing the same imaging field over a several week period. Insets show data acquired at ×4 digital zoom. Scale bar is 200 μm, inset scale bar is 20 μm. (B) Single L2/3 PyrN ROI masks. Green masks indicate cells found on the current day and all previous days using a cell score threshold of 0.8 (see Figure 6—figure supplement 1). (C) Normalized 8 kHz intensity-response functions for the four PyrNs highlighted in B. Neurons in the intact region show temporary increases in their responses while neurons in the deafferented region show permanent hyperresponsiveness. (D) Mean fold change in response to 8 kHz tones of varying intensities for individual neurons relative to their own response function measured prior to noise exposure (n = 303/552, trauma/sham). Gain is strongly elevated in both regions hours after trauma. Sustained gain increases are observed in the deafferented zone for at least 1 week following trauma but not in the intact zone. Four-way analysis of variance (ANOVA) with Group and Region as factors, and Time and Intensity as repeated measures (main effects, respectively: F = 6.87, p = 0.01; F = 2.9, p = 0.09; F = 8.69, p = 4 × 10⁻⁵; F = 116.61, p = 8 × 10–13; Group × Region × Time × Intensity interaction term: F = 6.65; p = 0.0004).

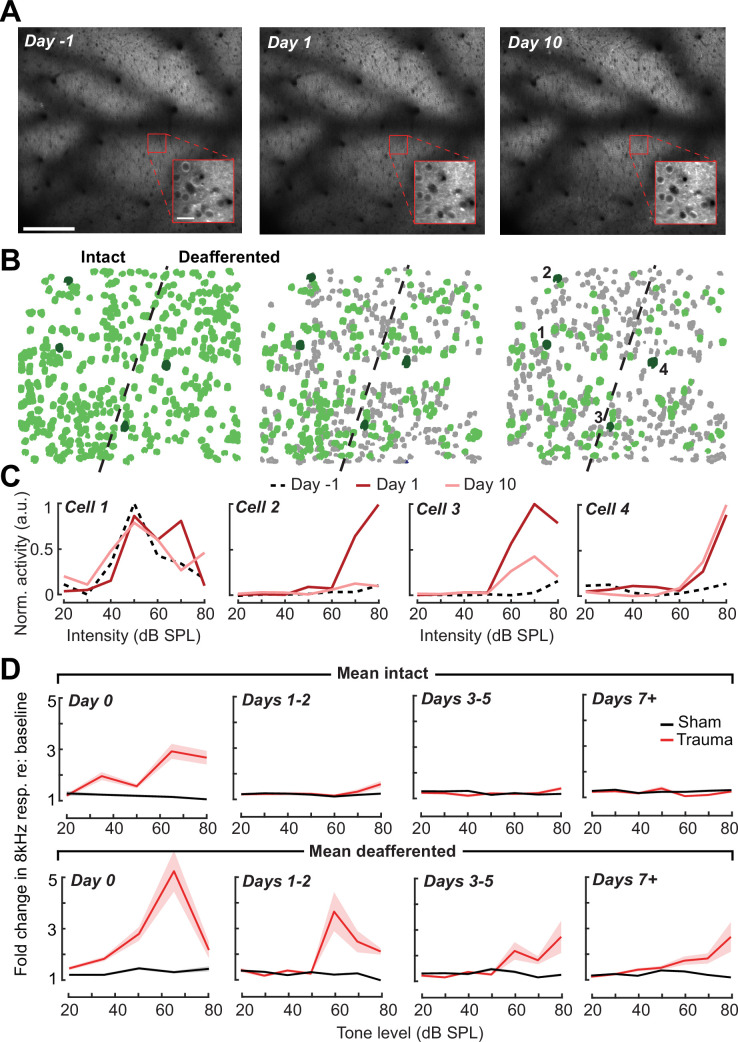
Figure 6.

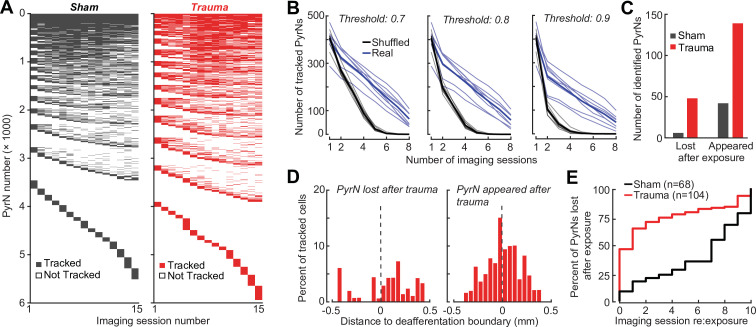
Figure 6—figure supplement 1. Validation of single cell tracking over imaging days.

Figure 6—figure supplement 1.

(A) Representation of all neurons found across noise- and sham-exposed mice. Cells are initially sorted by the number of sessions they were tracked (descending order) and then by the first session they were identified (ascending order). (B) To set criteria for identifying chronically tracked cells, we performed the same tracking algorithm on shuffled fields-of-view taken from the eight different mice. We have plotted the number cells tracked across eight sessions in real and shuffled datasets for different confidence thresholds. Falsely tracked PyrNs were not observed at a confidence threshold of 0.8 at eight sessions. (C) Cells reliably tracked for four baseline sessions that disappeared for all subsequent imaging sessions after noise exposure were labeled ‘lost’, while cells not present at baseline that were subsequently identified and tracked after noise exposure were labeled ‘appeared’. (D) After trauma, the location of the ‘lost’ and ‘appeared’ cells in the cortical map relative to the total number of cells found at each location and expressed as a percentage. Lost cells were largely found in the deafferented (high frequency) region, while appeared cells were concentrated around the deafferentation boundary. (E) The approach for identifying stable PyrNs that permanently disappeared on the day of noise exposure (C) was extended to all post-exposure days. Cells that were identified for every session up to a given point and then not identified for all subsequent sessions were identified as ‘lost’. Approximately 75% of lost PryNs disappeared within 48 hr after acoustic trauma. By contrast, the smaller set of lost PyrNs in sham-exposed mice mostly disappeared toward the end of the chronic imaging period.