
Figure 6.
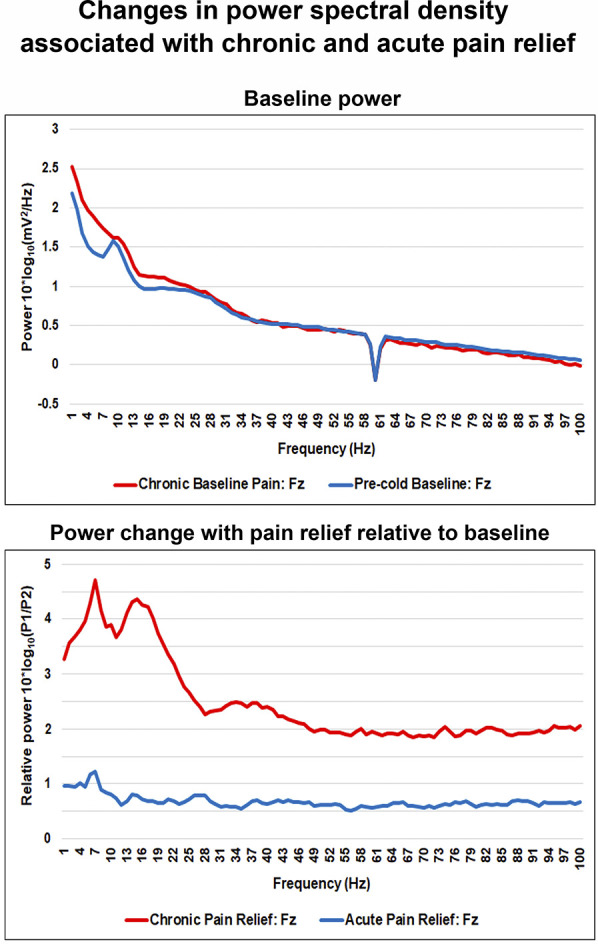
Changes in power spectral density at the Fz electrode with chronic and acute pain relief. Power spectra were averaged across participants per group. Top panel: baseline log power spectra at the Fz electrode. Bottom panel: power spectra at the Fz electrode during chronic and acute pain relief relative to baseline conditions (log power ratio).