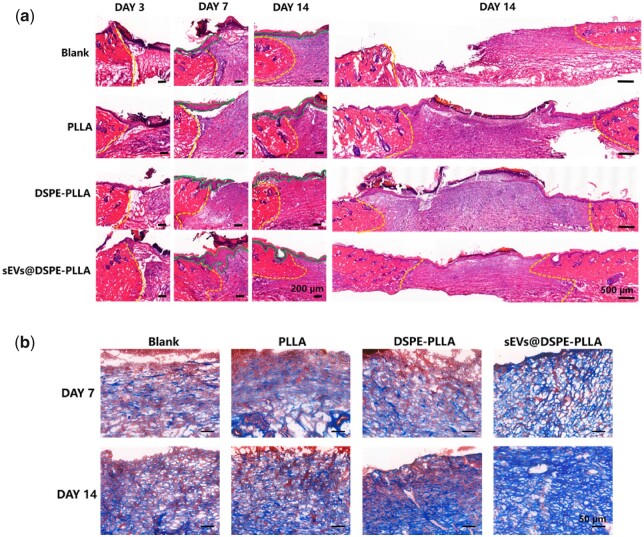
Figure 9.
Histological analysis of the wounds in diabetic rats. (a) HE staining images of wound tissues on Days 3, 7 and 14. The yellow dotted lines are the boundary between the wound and normal tissue, and the green solid lines outline the epidermal tongues. (b) Representative images of Masson’s trichrome staining on Days 7 and 14.

