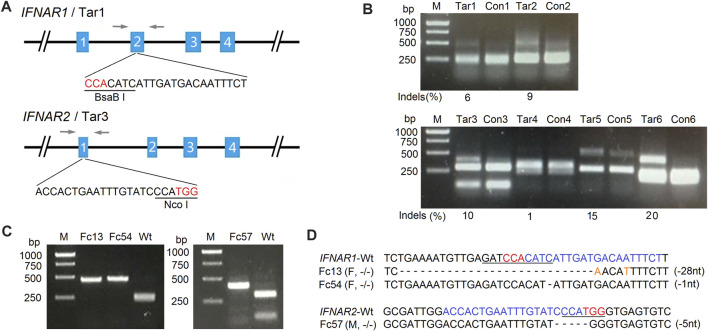
FIGURE 1.
Generation of IFNAR1 −/− and IFNAR2 −/− sheep fetal fibroblast colonies for SCNT by CRISPR/Cas9. (A) Schematic diagram of IFNAR1 and IFNAR2 targeting sites. The single-guide RNA (sgRNA) target sequences for each locus are depicted, with the restriction enzyme recognition sites used for PCR-RFLP assays underlined. Letters in red indicate protospacer-adjacent motifs (PAMs). Arrows indicate locations of PCR primers. (B) Gene targeting efficiency analysis of two targeting vectors for the IFNAR1 locus (upper panel) and four targeting vectors for the IFNAR2 locus (lower panel) in SFFs detected by PCR-RFLP assays. M, 1-kb DNA ladder; Con, control (WT SFFs); Tar, SFFs transfected with each targeting vector. The targeted alleles lost restriction sites through error-prone non-homologous end joining (NHEJ) following Cas9-mediated double-stranded DNA breaks. The mutation efficiency (indels) of targeting vector 1 (Tar1) was 6% and of targeting vector 3 (Tar3) was 10%. These are the targeting vectors that were used for the generation of the IFNAR1 −/− and IFNAR2 −/− sheep fetal fibroblast colonies, respectively. (C) PCR-RFLP assays for the detection of IFNAR1 −/− and IFNAR2 −/− single-cell derived SFF colonies with mutations at IFNAR1 (left) and IFNAR2 (right). (D) Sequencing analysis of IFNAR1 −/− and IFNAR2 −/− colonies. Letters in blue indicate sgRNA sequences and orange nucleotides replaced at cleavage sites. M, male; F, female; −/−, both alleles targeted; –1 nt, one nucleotide deletion.

