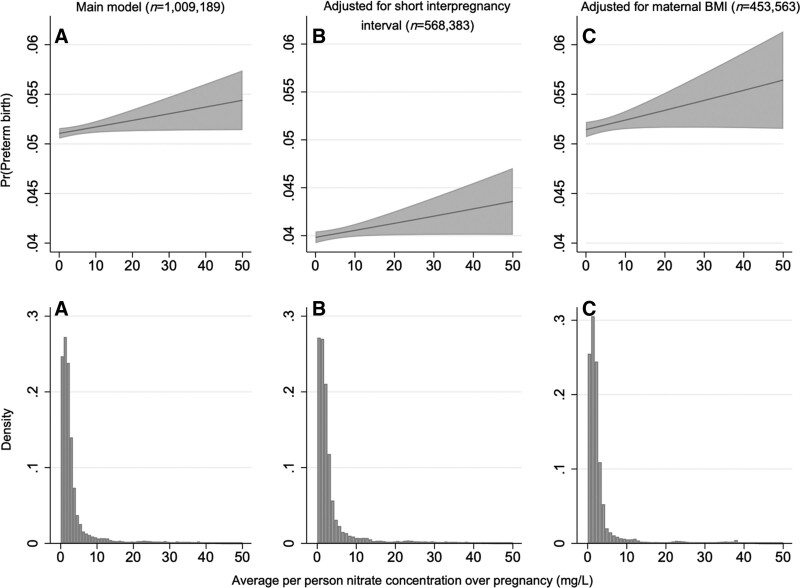
Figure 2.
Distribution of the pregnancy average nitrate exposure, truncated to those with ≤50 mg/L average nitrate exposure, and the corresponding probability of preterm birth in (A) the main model, (B) main model with further adjustment for short interpregnancy interval, and (C) main model with further adjustment for maternal pre-pregnancy body mass index. Main model covariates included calendar year, sex, birth order urbanicity, and maternal age, smoking, education, income, and employment status.

