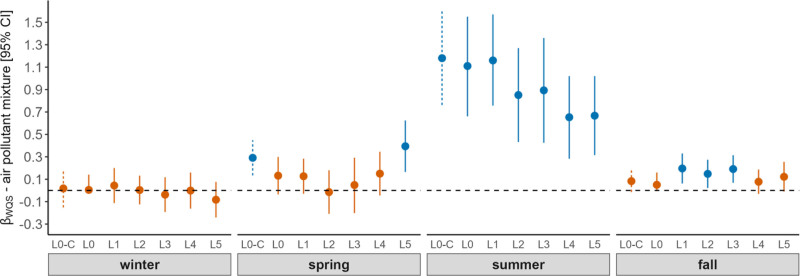
Figure 1.
Association between outdoor air pollutant mixture and pediatric asthma exacerbations. The y axis represents the beta coefficient (effect estimate) of outdoor air pollutant mixture. The x axis represents seasons of a year. The CIs of the crude model are represented using dotted line and the adjusted model using solid line. Adjusted model includes temperature, precipitation, wind speed and direction as covariates. Effect estimates with statistically significant association were represented using blue and statistically nonsignificant associations were represented using orange. The effect estimates and 95% CIs were generated using qWQS regression with 100 repeated holdouts. L0-C represents the crude effect estimate with the same-day exposure-response association. L0–L5 are the adjusted effect estimates, where “0” represents the same day association and 1–5 represent the exposure-delayed response associations ranging from 1 to 5 days.

