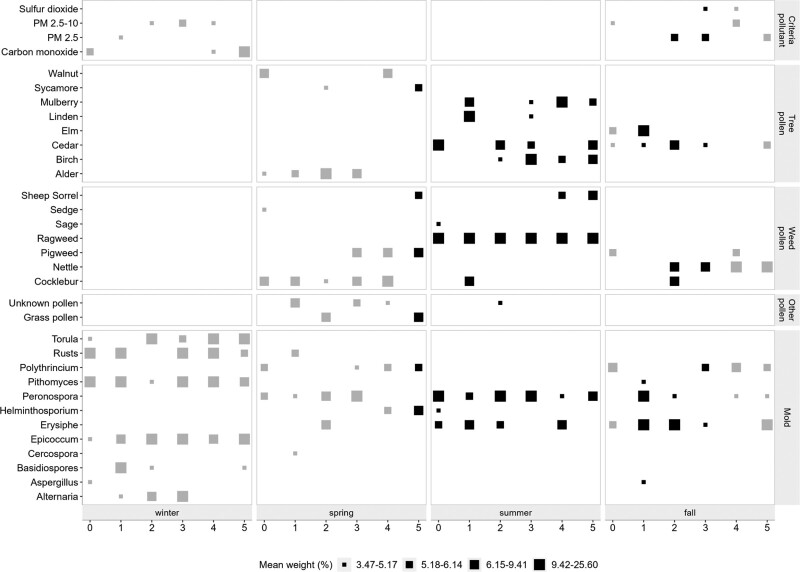
Figure 2.
Contribution of individual pollutant to the air pollutant mixture weights. The x axis represent the lag period (0–5 days) by season. The y axis represent individual air pollutants contributed to the mixture effect. The size of the squares represents the percent mean weight of the pollutant contributed to the pollutant mixture. Larger the size of the square represents higher weight. The color of each square represents if the pollutant weight obtained from a model with statistically significant associations (Gray, nonsignificant; black, significant associations). Pollutant weights were obtained from the gWQS regression with 100 repeated holdouts.

