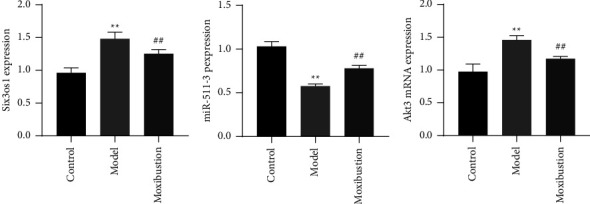
Figure 4.

Expression of the lncRNAs Six3os1, miR-511-3p, and AKT3 in the hippocampus (mean ± SD, n = 6). Note: ∗∗indicates significant difference versus the control group, at p < 0.01; ##indicates significant difference versus the AD model group, at p < 0.01.
