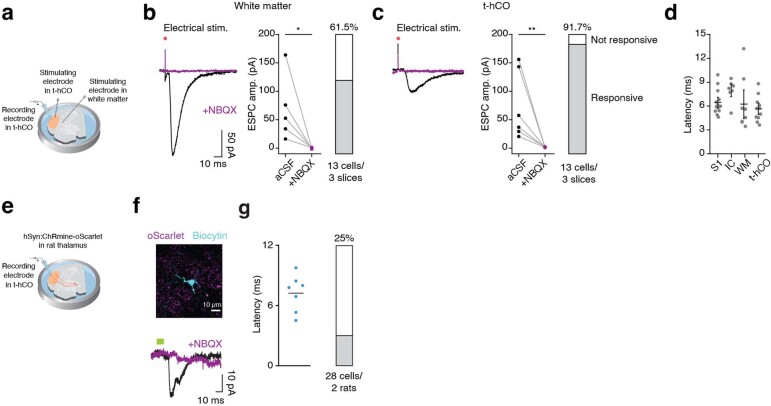
Extended Data Fig. 9. Electrophysiological characterization of inputs onto t-hCO.
a. Schematic of experimental preparation for electrically activating rat tissue while performing whole cell recordings from t-hCO neurons. b. Left, current traces from a representative t-hCO neuron following electrical stimulation in white matter with (purple) or without (black) NBQX. Middle, quantification of EPSC amplitude with or without NBQX (paired t-test, *P = 0.0295). Right, percentage of t-hCO neurons that displayed EPSCs in response to electrical stimulation in white matter. c. Left, Current traces from a representative t-hCO neuron following electrical stimulation of t-hCO with (purple) or without (black) NBQX. Middle, quantification of EPSC amplitude with or without NBQX (Wilcoxon test, **P = 0.0022). Right, percentage of t-hCO neurons that displayed EPSCs in response to electrical stimulation of t-hCO. d. Latency to EPSC in t-hCO neurons following electrical stimulation of somatosensory cortex (S1, n = 13 neurons), internal capsule (IC, n = 7 neurons), white matter (WM, n = 8 neurons), or t-hCO (n = 11 neurons). e. Schematic of experimental preparation for optogenetically activating rat thalamic terminals in t-hCO while performing whole cell recordings from t-hCO neurons. f. Top, example recorded t-hCO neuron. Bottom, current traces from a representative t-hCO neuron following optogenetic activation of rat thalamic terminals in t-hCO with (purple) or without (black) NBQX. g, Left, latency to EPSC in t-hCO neurons following optogenetic activation of rat thalamic terminals in t-hCO (n = 7 neurons, 2 animals). Right, percentage of t-hCO neurons that displayed EPSCs in response to optogenetic activation of rat thalamic terminals in t-hCO. Data are presented as mean ± SEM.

