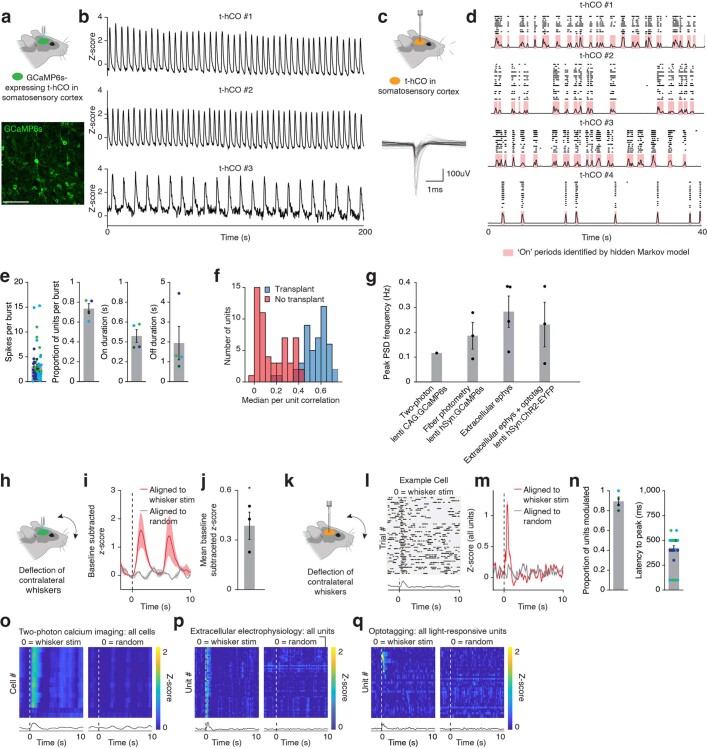
Extended Data Fig. 10. Characterization of t-hCO activity in vivo.
a–g. Characterization of spontaneous activity in t-hCO in vivo. a–c. Fiber photometry recordings of spontaneous t-hCO activity in vivo. a. Top, Schematic of experimental preparation. Bottom, representative image of GcaMP6s expression in t-hCO. Scale bar, 100 μm. b. Example z-scored fluorescence traces from awake recording of spontaneous activity. c–f. Extracellular recordings of spontaneous t-hCO activity in vivo. c. Top, Schematic of experimental preparation. Bottom, average waveforms of putative t-hCO units. d. Hidden Markov model used to identify ‘on’ and ‘off’ periods of population activity. Top, raster plot of spontaneous activity of simultaneously recorded units. Bottom, population averaged z-scored activity with ‘on’ states identified by Hidden Markov model overlaid in red. e. Quantification of spontaneous spiking activity. Left, number of spikes each unit contributed to each burst (n = 4 rats, 10 (dark green), 12 (light green), 19 (cyan), and 14 (blue) units per rat). Left center, proportion of recorded units that were engaged in each burst (n = 4 rats). Right center, ON period duration (n = 4 rats). Right, OFF period duration (n = 4 rats). f. Histogram of median correlations of each unit with all other simultaneously recorded units recorded in transplanted rats (putative human units, blue, n = 48 units from 4 rats) or non-transplanted rats (rat units, red, n = 56 units from 3 rats, P < 0.0001). g. Peak power spectral density frequency of spontaneous activity across all recording modalities used (two photon n = 1 rat, fiber photometry n = 3 rats, extracellular electrophysiology n = 4 rats, optotag n = 3 rats). h–q. Characterization of evoked activity in t-hCO in vivo. h–j. Fiber photometry recordings of t-hCO activity in response to whisker deflection. h. Schematic of experimental preparation for fiber photometry recording of t-hCO neurons in response to whisker deflection. i. Z-scored responses to whisker deflection at time zero (red) or randomly generated timestamps (grey) averaged across animals (n = 3 rats). j. Quantification of mean z-score following whisker stimulation compared to baseline (n = 3 rats, *P = 0.0430). k–n. Extracellular electrophysiological recordings of t-hCO activity in response to whisker deflection. k. Schematic of experimental preparation for extracellular electrophysiological recordings of t-hCO activity in response to whisker deflection. l. Single trial responses to whisker stimulation from a representative example single unit. Top, raster plot of single trial spiking activity aligned to whisker deflection. Bottom, trial-averaged z-scored firing rate. m. Population-averaged z-scored firing rates of all cells aligned to whisker deflection at time zero (red) or randomly generated timestamps (grey). n. Quantification of evoked spiking activity. Left, proportion of units significantly modulated by whisker deflection (n = 4 rats). Right, latency to peak z-score (n = 4 rats, n = 8 (dark green), 11 (light green), 12 (cyan), and 11 (blue) whisker deflection-modulated units per rat). o–q. Heatmaps of trial-averaged responses of all identified putative t-hCO cells across different recording modalities. o. Top, heatmap of trial-averaged z-scored fluorescence traces from all t-hCO cells recorded with two-photon calcium imaging aligned to whisker deflection (left) or randomly generated timestamps (right). Bottom, population-averaged z-scored fluorescence traces (n = 14 cells from 1 rat). p. Top, heatmap of trial-averaged z-scored firing rates from all t-hCO units recorded with extracellular electrophysiology aligned to whisker deflection (left) or randomly generated timestamps (right). Bottom, population-averaged z-scored firing rates (n = 42 units from 4 rats). q. Top, heatmap of trial-averaged z-scored firing rates from all opto-tagged t-hCO units recorded with extracellular electrophysiology aligned to whisker deflection (left) or randomly generated timestamps (right). Bottom, population-averaged z-scored firing rates (n = 31 units from 3 rats). Data are presented as mean ± SEM.

