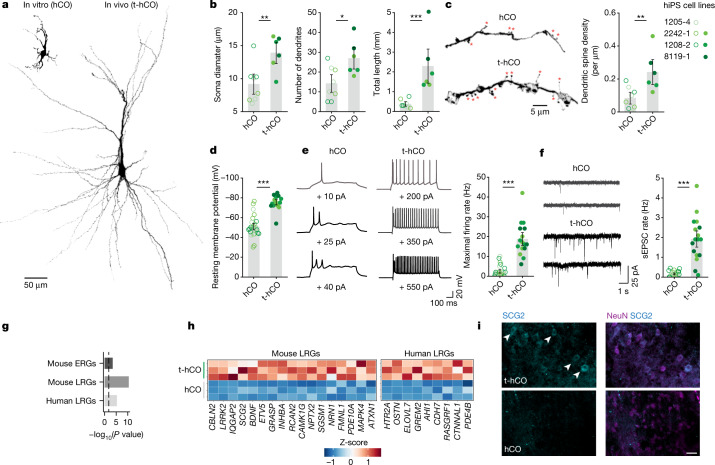
Fig. 2. t-hCO neurons undergo advanced maturation.
a, 3D reconstruction of biocytin-filled hCO and t-hCO neurons at 8 months of differentiation. b, Quantification of morphological features (n = 8 hCO neurons, n = 6 t-hCO neurons; **P = 0.0084, *P = 0.0179 and ***P < 0.0001). c, 3D-reconstructed dendritic branches of hCO and t-hCO at 8 months of differentiation. The red asterisks indicate putative dendritic spines. Quantification of dendritic spine density (n = 8 hCO neurons, n = 6 t-hCO neurons; **P = 0.0092). d, Quantification of the resting membrane potential (n = 25 hCO neurons, n = 16 t-hCO neurons; ***P < 0.0001). e, Repetitive action potential firing in hCO and t-hCO induced by increasing current injections, and quantification of the maximal firing rate (n = 25 hCO neurons, n = 16 t-hCO neurons; ***P < 0.0001). f, Spontaneous EPSCs (sEPSCs) in hCO and t-hCO neurons at 8 months of differentiation, and quantification of the frequency of synaptic events (n = 25 hCO neurons, n = 17 t-hCO neurons; ***P < 0.0001). For b–f, hCO and t-hCO from line 1208-2 are taken from the same differentiation batch maintained in parallel. g, Gene set enrichment analysis (one-sided Fisher’s exact test) of genes significantly upregulated (adjusted P < 0.05, fold change > 2, expressed in at least 10% of nuclei) in t-hCO glutamatergic neurons compared with hCO glutamatergic neurons with gene sets of both early-response (ERG) and late-response (LRG) activity-dependent genes identified from an in vivo mouse study16 and human-specific LRGs from in vitro neurons17. The dashed line denotes Bonferroni-corrected P value of 0.05. h, GluN gene expression (pseudobulk and scaled for each gene) across snRNA-seq replicates of LRG genes significantly upregulated in t-hCO glutamatergic neurons. i, Immunostaining showing SCG2 expression in t-hCO (top) and hCO (bottom) neurons. White arrowheads indicate SCG2+ cells. Scale bar, 25 µm. Data are presented as mean ± s.e.m.

