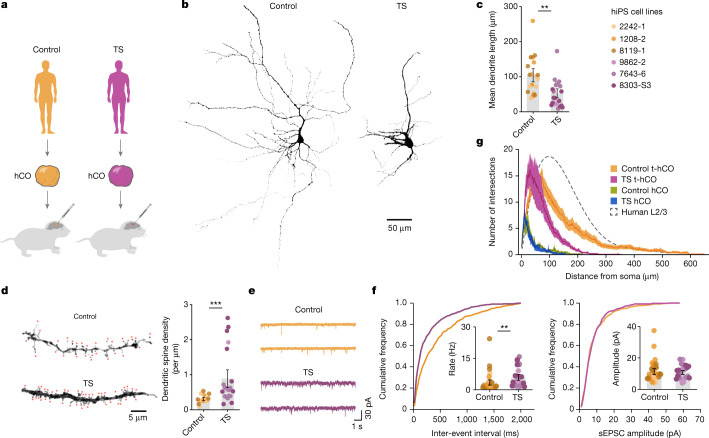
Fig. 3. Advanced neuronal features in t-hCO reveal activity-dependent disease phenotypes in human cortical neurons.
a, Transplantation of hCO generated from control and TS hiPS cell lines into newborn rats. b, 3D reconstruction of biocytin-filled t-hCO neurons at 8 months of differentiation. c, Quantification of mean dendrite length (n = 19 control neurons, n = 21 TS neurons; **P = 0.0041). d, 3D-reconstructed dendritic branches from control and TS t-hCO at 8 months of differentiation, and quantification of dendritic spine density (n = 16 control neurons, n = 21 TS neurons, ***P < 0.0001). Red asterisks indicate putative dendritic spines. e, Spontaneous EPSCs in control and TS t-hCO neurons at 8 months of differentiation. f, Cumulative frequency plots and quantification of synaptic event frequency and amplitude (n = 32 control neurons, n = 26 TS neurons; **P = 0.0076 and P = 0.8102). g, Sholl analysis of TS and control neurons in hCO and t-hCO. The dashed line shows postnatal human L2/3 pyramidal neurons for comparison (n = 24 control t-hCO neurons, n = 21 TS t-hCO neurons, n = 8 control hCO neurons and n = 7 TS hCO neurons). Data are presented as mean ± s.e.m.

