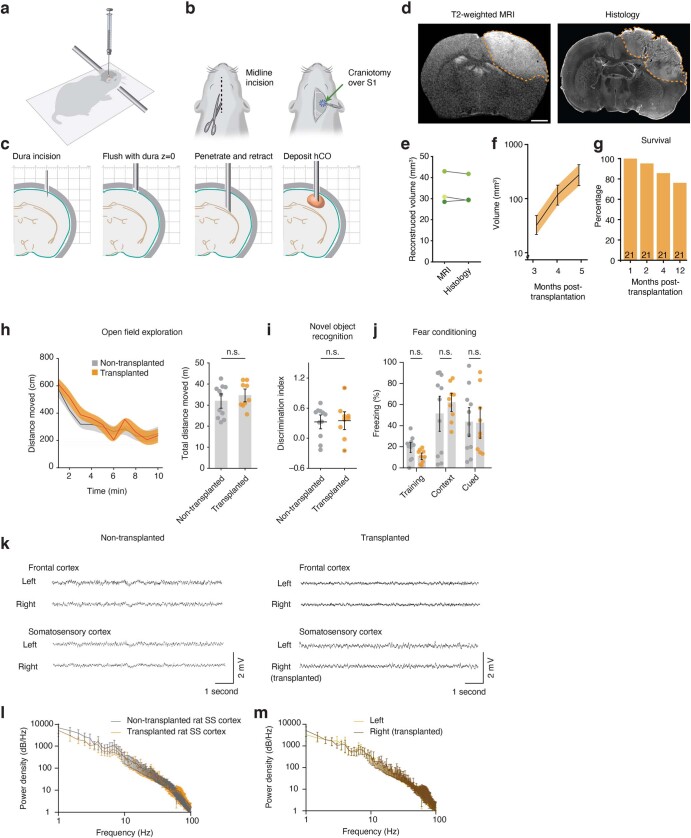
Extended Data Fig. 1. Schematic of the transplantation procedure and effects on animal behaviour.
a–c. Schematics of surgical approach. d. Left, t-hCO visualized with T2-weighted MRI. Right, t-hCO visualized with DAPI. e. Reconstructed volumes of the same t-hCO calculated from MRI or histological slices (n = 3, P = 0.9160 t-hCO). f. Quantification of MRI volume reconstruction over time (n = 6 t-hCO, *P = 0.0239). g. Quantification of survival in transplanted animals over time. h–j. Animals transplanted with t-hCO do not show behavioral deficits or seizures. h. Distance traveled in open field arena by transplanted (orange) or non-transplanted control animals (grey) for each minute of a 10-minute testing session (left) and across the entire 10-minute testing period (right) (n = 11 non-transplanted control rats, 9 transplanted rats, P = 0.4082). i. Discrimination index ((time spent interacting with novel object - time spent interacting with familiar object)/(time spent interacting with novel object + time spent interacting with familiar object)) during novel object test calculated for transplanted (orange) or non-transplanted control animals (grey) (n = 11 non-transplanted control rats, 9 transplanted rats, P = 0.8756). j. Freezing behaviour during fear conditioning training, contextual fear memory test, and cued fear memory test for transplanted (orange) or non-transplanted control animals (grey) (n = 11 non-transplanted control rats, 9 transplanted rats, P = 0.9599). k. Representative EEG recordings from the frontal and somatosensory cortices of non-transplanted (left) and transplanted (right) rats. l. Power spectral density plots of EEG activity recorded in the somatosensory cortex of non-transplanted control and transplanted rats (n = 3 transplanted rats, 3 non-transplanted rats). m. Power spectral density plots of somatosensory cortex EEG activity recorded simultaneously in the non-transplanted and transplanted hemisphere of individual rats (n = 3 transplanted rats). Data are presented as mean ± SEM.

